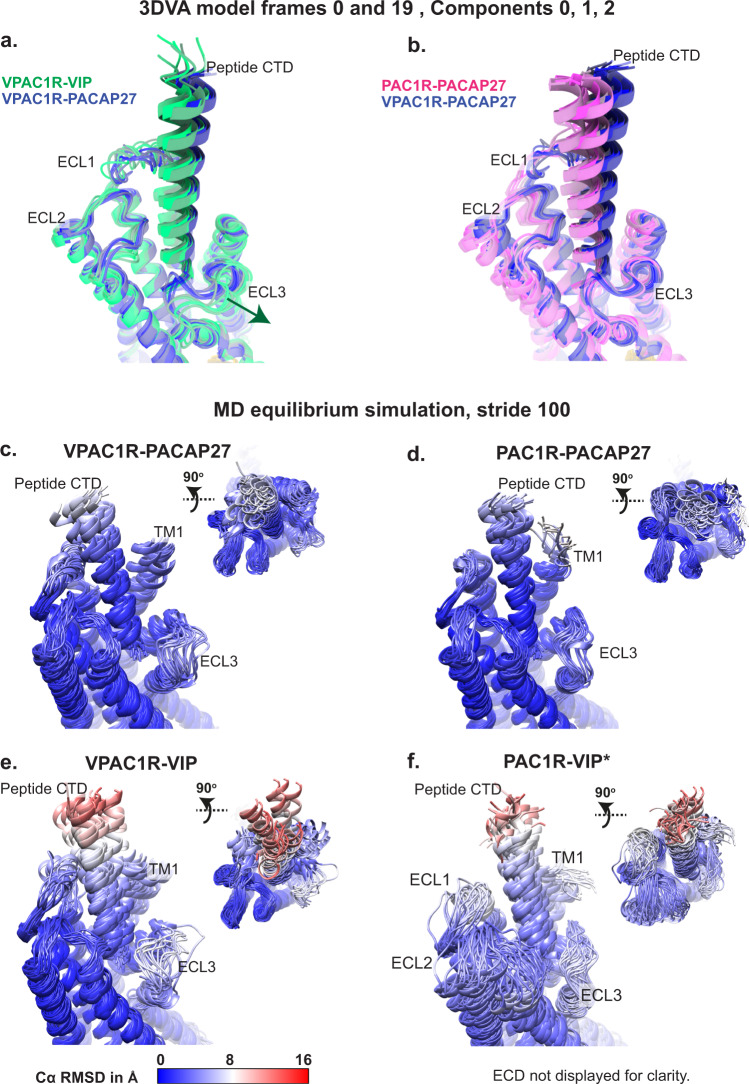
Fig. 3. Dynamic analyses of receptor-peptide complexes by cryo-EM 3D variability analysis and MD simulations.
a, b VPAC1R-VIP (green), VPAC1R-PACAP27 (blue) and PAC1R-PACAP27 (pink) atomic coordinate frames derived from the cryoSPARC 3DVA extreme frames (frame 0 and 19) from each component (component 0 to 2) were overlayed and different frames were coloured in a colour gradient according to their peptide-receptor pair (Comp 0, frame 0 lowest saturation, Comp 2, frame 19 highest saturation). c–f Snapshots of the MD equilibrium simulation from the experimental structures of VPAC1R-PACAP27, PAC1R-PACAP27 and VPAC1R-VIP, as well as the PAC1R-VIP homology model (as indicated by asterisk *). Simulations were run without the ECD-ECL1 disulfide bond present. Snapshots were extracted from the simulations as PDBs (extracting every 100th frame), opened in Chimera and coloured by Cα RMSD in Å, in a colour scale from 0 Å = blue to 16 Å = red. The receptor and peptide backbones are displayed in ribbon format and shown as front view of the receptor TMs and peptide and top view. ECD residues of the PAC1R and VPAC1R receptor are not displayed for clarity. For the PAC1R-VIP homology model, the MD simulations did not consider the full-length Gs protein (only the Gα H5 was retained).

