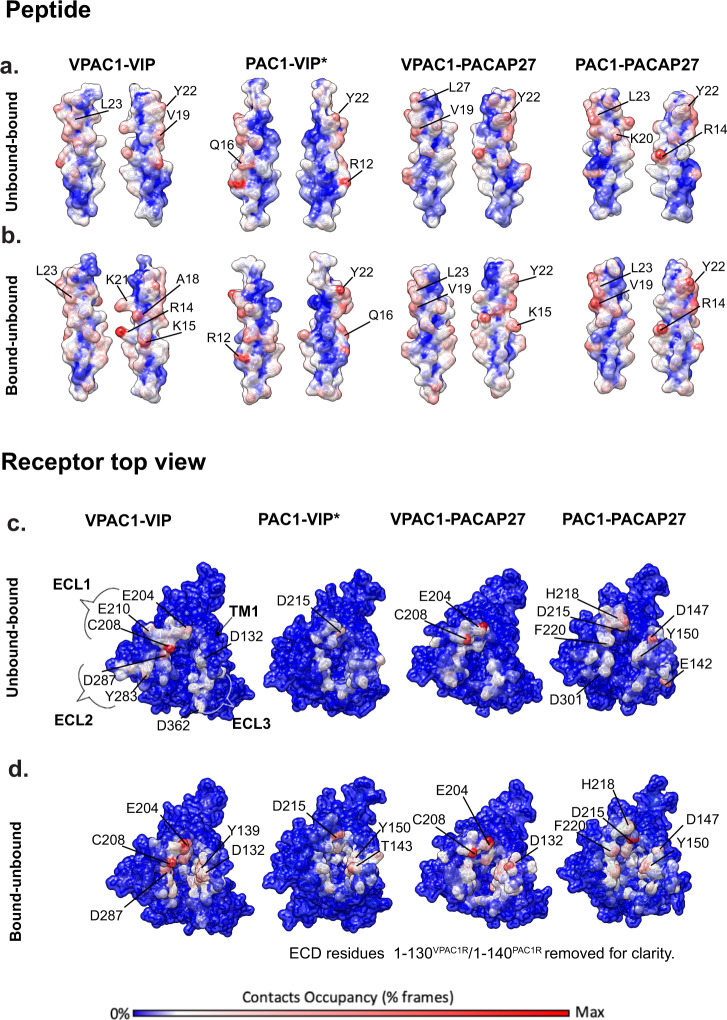
Fig. 4. Contact occupancies based on unbinding and binding MD simulations comparing contacts between VIP and PACAP27, and PAC1R and VPAC1R.
MD simulations were performed on the experimental PAC1R-PACAP27, VPAC1R-VIP and VPAC1R-PACAP27 complexes and the PAC1R-VIP (homology model, as indicated by asterisk *). The total occupancy (% MD frames) for each atom is plotted on the surface of the peptide (a, b) or receptor (c, d) according to a colour scale from 0 % contacts occupancy = blue to maximum contacts occupancy = red. a, b Two-sided view of VIP and PACAP27 peptide (surface representation) with occupancies plotted based on the binding simulation (a) or unbinding simulation (b). c–d Top view of receptors PAC1R and VPAC1R (surface representation) with occupancies plotted based on the binding simulation (c) or unbinding simulation (d). ECD residues of PAC1R and VPAC1R were removed for clarity.

