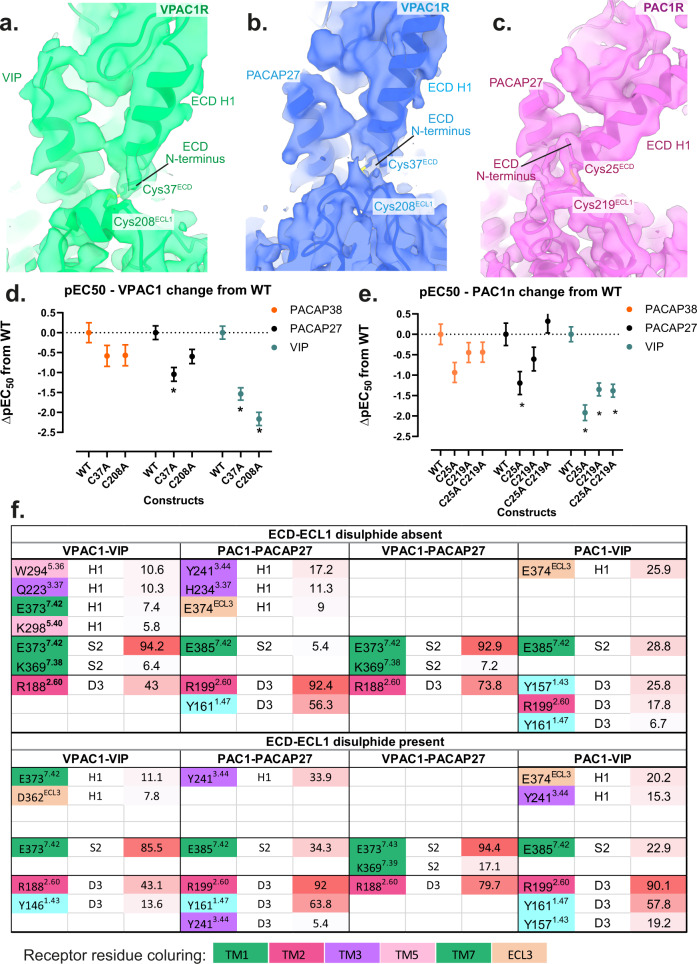
Fig. 6. Potential disulfide bond structure and function in the ECD helix 1 and ECL1 of VPAC1R and PAC1R.
a–c Cryo-EM maps of the receptor-alone focused refinements of VPAC1R-VIP (green), VPAC1R-PACAP27 (blue) and PAC1R-PACAP27 (pink) shown as side view with a zoom onto the ECD Helix 1 and ECL1. Maps are shown in transparent and model backbones are shown in ribbon format. The relevant cysteines are shown as stick models, with the putative disulfide bond present. Due to ambiguity, the disulfide bond was not modelled in the final, deposited models, however, the relevant cysteine residues are in a position to potentially form a bond. Cysteines of interest are labelled according to their residue number: Cys37 (ECD) and Cys208 (ECL1) of the VPAC1R and Cys25 (ECD) and Cys219 (ECL1) of the PAC1R. d–e Differences in cAMP potency (pEC50) derived from concentration response analysis (data in Supplementary Fig. 13 comparing wild-type receptors to alanine mutant receptors lacking the relevant cysteines); d pEC50 of WT and C37A and C208A VPAC1R single mutations in response to PACAP38 (orange), PACAP27 (black) and VIP (dark cyan); e: pEC50 of WT, C25A, C219A and C25A/C219A in response to PACAP38 (blue), PACAP27 (red) and VIP (green). The data for panels d and e are the mean ± SEM, n = 3 independent experiments. Differences in potency between WT and mutant receptors was assessed using a one-way ANOVA and Dunnett’s post-test. Statistically Significant changes (p < 0.05) are indicated with asterisk (*). f Tabular comparison of N-terminal peptide residues (H1, S2, D3) hydrogen bonds with receptor residues, comparing the presence and absence of the ECD-ECL1 disulfide bond during the MD equilibrium simulation from the experimental structures of VPAC1R-PACAP27, PAC1R-PACAP27 and VPAC1R-VIP, and the PAC1R-VIP homology model. Interactions are listed by percentage of occupancy of frames, with the background colouring representing maximum occupancy % (red) and minimum occupancy % (white). Receptor residue background colouring is according to their residue numbering (TM transmembrane helix, ECL3 extracellular loop 3). Table is based on data presented in Supplementary Table 4. Source data for panels d and e are provided in the Source Data file.

