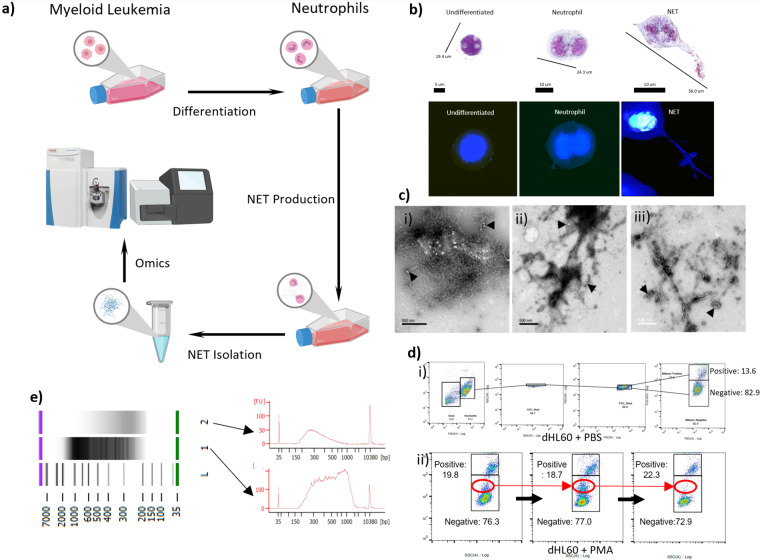
Fig. 1.
Neutrophil Extracellular Trap Production and Isolation. (a) Schematic of in vitro ecTrap production. Cultured HL-60 cell lines are incubated with DMSO to differentiate into neutrophils (dHL60 cells). After which, PMA stimulation leads to ecTrap production, isolation, and “omics” analysis. (b) Representative 3D holotomographic microscopy images digitally stained based on RI (refractive index) confirm the differentiation of HL-60 cells to neutrophils (dHL60) after 4 days in differentiation media, and successful release of ecTraps after 4-hour incubation in 1,000 nM PMA. (c. i-iii) Scanning electron microscope (SEM) images of isolated DNA samples from (i) HL-60 cells, (ii) dHL60 cells and (iii) released ecTrap of static cells. All samples show the presence of lipid bilayers (indicated by arrowheads). (d) Mitochondrial superoxide generation before - and during - ecTrap release process was measured by MitoSOX assay over 5 hours of incubation with PMA. (i) Doublet discrimination gating strategy was used to ensure accurate MitoSOX-red quantification. Panels shown are negative control (dHL60 in PBS) (ii) Representative panel of flow cytometry analysis shows the generation of superoxide in dHL60 on incubation with PMA over 0.5 hours. Red circle highlights a population shift from MitoSOX negative to MitoSOX positive. (e) DNA quantification by Agilent High-sensitive DNA chip verifies the composition of extracted ecTrap samples. Lane 1 shows an isolated ecTrap DNA sample. Lane 2 shows an isolated ecTrap sample after incubation with DNase to digest all DNA contents. Arrows indicate the electropherogram of each sample in the gel image above. Lane L shows the DNA ladder marker.

