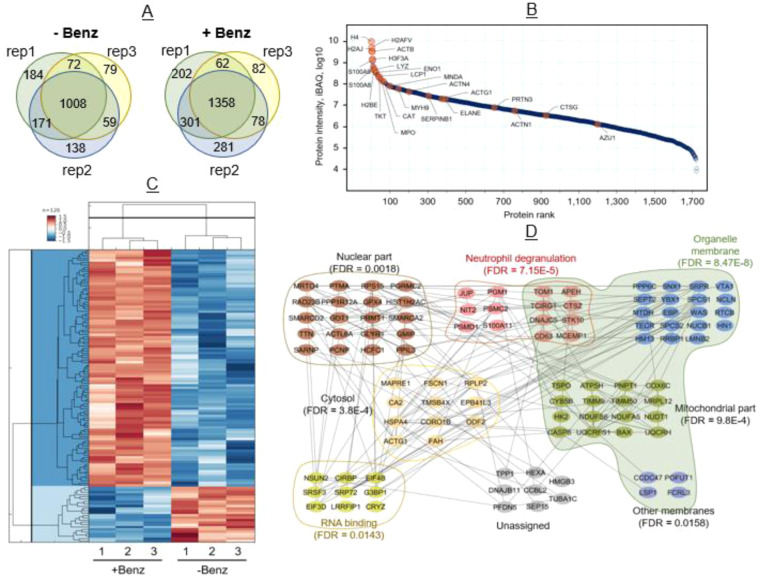
Fig. 2.
dHL60 induced ecTrap Proteome. (a) Proteome analysis of ecTrap from three representative samples (i.e., rep1, rep2, and rep3) identified a total of 2,364 proteins after Benzonase treatment and 1,711 proteins in untreated samples. Common proteins found among three representative samples in Benzonase treated and untreated ecTrap is 1,358 and 1,008, respectively. (b) Dynamic range of the ecTrap proteome. Data showing (1,722 proteins) here is from Benzonase-treated ecTrap. Median values of the three replicate experiments were used for the plot. Previously reported proteins associated with NET by Urban et. al. denoted by orange dots, most of which ranked among the 100 most abundant proteins found in our ecTrap samples. (Median value of three experimental replicates are plotted here). (c) Hierarchical clustering of the 126 significant proteins (fold change ≥2 or ≤−2; Permutation FDR 0.05) between the two groups. Z-scored LFQ intensities were color-coded as indicated in the scale bar. (d) STRING protein network and Gene Ontology analysis of 101(out of 126) significantly enriched proteins in ecTraps after Benzonase treatment were analysed using embedded STRING app in CytoScape software (version 3.7.2). The confidence score cut-off was set to 0.4. Representative enriched gene ontology (GO) terms (e.g., biological process, molecular function, and cellular compartment) and corresponding FDR values were depicted in the network.

