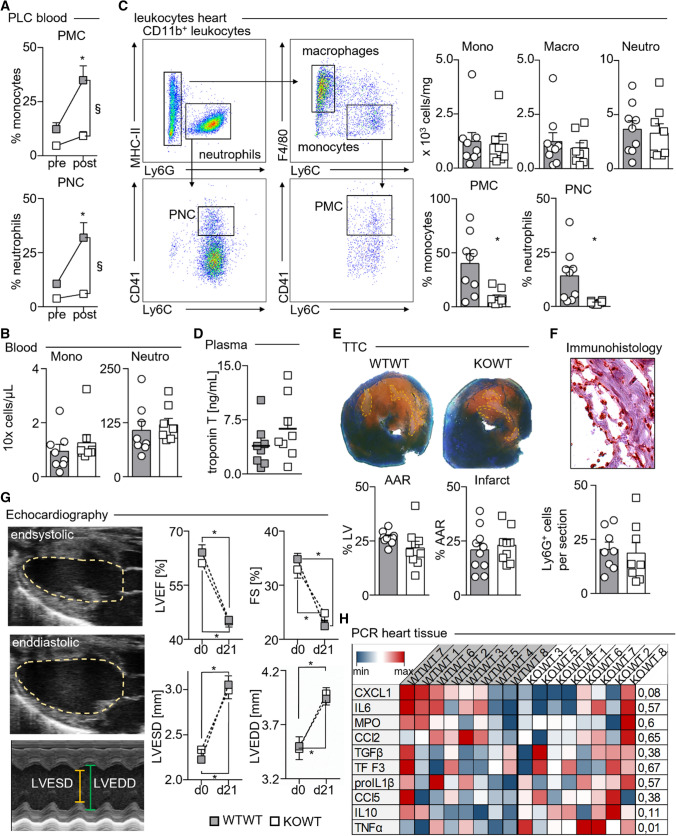
Fig. 4.
PLC have no major impact on infarct size and cardiac function post-myocardial infarction. A Fractions of PMC, and PNC before and 24 h after myocardial I/R injury in WTWT and KOWT chimeras. WTWT chimeras, *p < 0.05 denote statistically significant differences between time points within the same group and §p < 0.05 between groups at the same time point. Results are presented as mean ± SEM, n = 8 per group, two-way ANOVA). B Blood counts for monocytes (Mono) and neutrophils (Neutro) 24 h after myocardial I/R injury. Results are presented as mean ± SEM, n = 8 per group. C Representative dot plots showing gating for leukocyte populations in enzymatically digested infarcted myocardium (left) and quantification of Ly6Chigh monocytes, neutrophils, PMC and PNC, and macrophages. Results are presented as mean ± SEM, *p < 0.05 denote statistically significant differences between groups, n = 9 for WTWT and n = 8 for KOWT, t test). D High-sensitive Troponin T plasma levels in WTWT and KOWT chimeras 24 h after myocardial I/R injury. Results are presented as mean ± SEM, n = 8 per group, t test. E Representative images of left ventricle (LV) sections stained with 2,3,5-triphenyltetrazolium chloride (TTC) and quantification of the area at risk (AAR) and the infarcted area within (infarct). Results are presented as mean ± SEM, n = 10 for WTWT, n = 9 for KOWT. F Representative image of anti-Ly6G stained infarct areas and quantification of mean Ly6G + neutrophil numbers per LV section (ten sections analyzed per mouse). Results are presented as mean ± SEM, n = 8 per group, t test. G Echocardiographic analysis (representative pictures of B- and M-Mode for left-ventricular end-systolic and end-diastolic dimensions depicted) before and 21 days after myocardial I/R injury in WTWT and KOWT chimeras. Results are presented as mean ± SEM, n = 5 per group at d0, and n = 8 per group at d21, Two-way ANOVA). H Heat map depicting qRT-PCR-based expression levels of key genes relative to mean values of the respective genes in WTWT chimeras (blue = lowest, white = mean; red = highest gene expression) n = 8 per group; p values calculated with multiple t-testing and Bonferroni correction, and p < 0.05 denoting statically significant differences between groups

