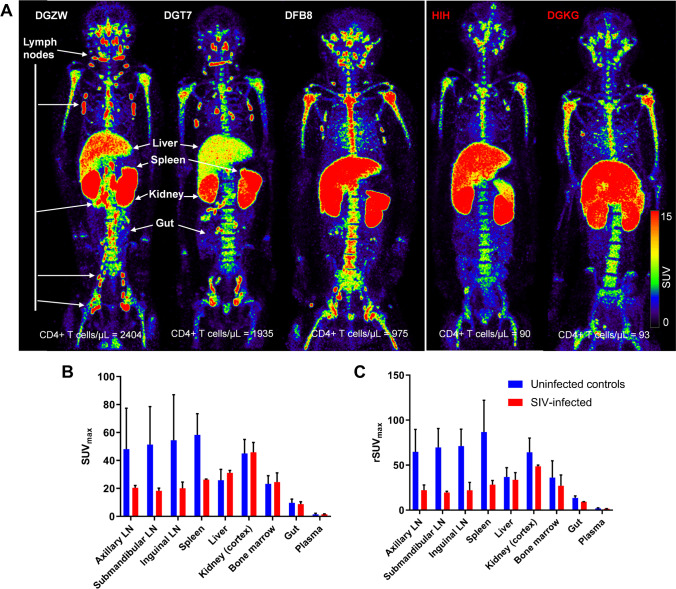
Fig. 1.
[89Zr]CD4R1-F(ab′)2 biodistribution following administration of 100 μg mass of mAb. A Maximum intensity projection in vivo PET images of rhesus macaques showing the comparison of radioligand uptake between uninfected controls (DGZW, DGT7, and DFB8) and SIV-infected animals (HIH and DGKG) scanned at 40–48 h post-injection. Tissue uptakes were converted to RAINBOW color map as shown in the color bar, where red color indicates the high standardized uptake value (SUV). Comparison of maximum SUV (SUVmax) in tissues and SUV in the plasma (B), and blood pool adjusted SUVmax (rSUVmax) (C) in tissues and plasma between uninfected controls (blue, n = 3) and SIV-infected animals (red, n = 2) at 40–48 h post-injection. Plasma SUV was calculated from the gamma counter. Plots are mean values and error bars are standard deviation

