Figure 3.

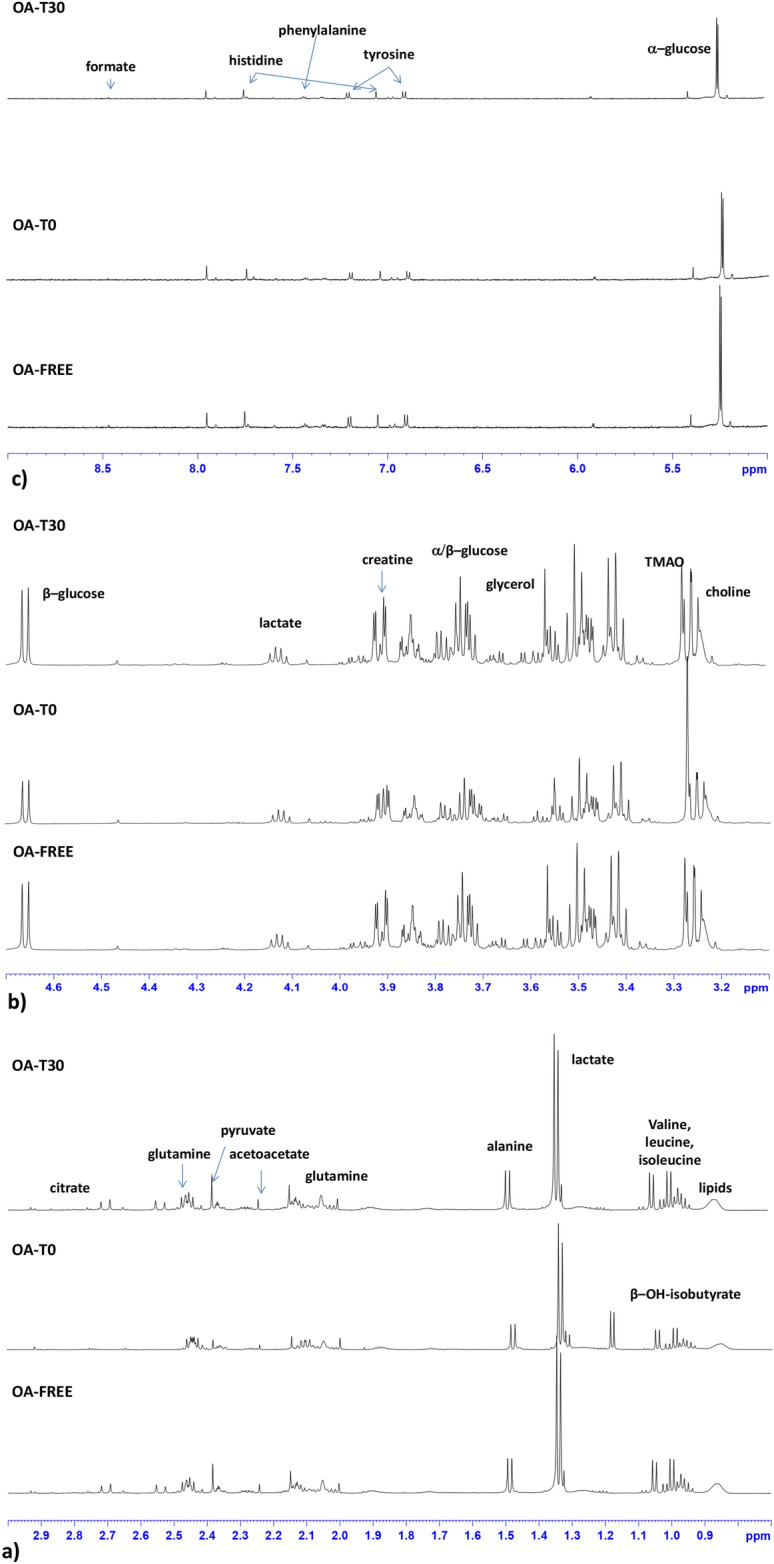
Stacked plot of 600 MHz typical cmpgpr 1H-NMR spectrum of OA-free, OA-T0 and OA-T30 SF samples. Expanded area in the range of (a) 0.5–3.00 ppm, (b) 3.00–5.00 ppm, and (c) 5.00–10 ppm. The assignment of the main peaks is indicated.

Stacked plot of 600 MHz typical cmpgpr 1H-NMR spectrum of OA-free, OA-T0 and OA-T30 SF samples. Expanded area in the range of (a) 0.5–3.00 ppm, (b) 3.00–5.00 ppm, and (c) 5.00–10 ppm. The assignment of the main peaks is indicated.