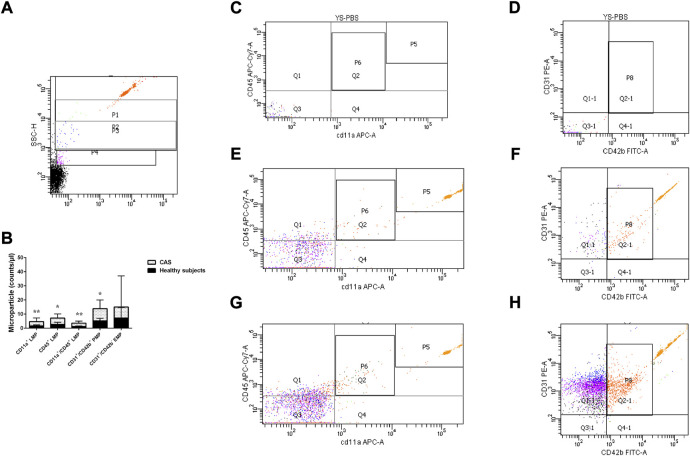
FIGURE 2.
(A) P1-P3 represent gates set with bead standards 1, 0.5, and 0.24 μm, respectively. (B). The quantitative expression of LMP, PMP, and EMP in the two groups. (C,D) stand for the negative control. (E,F) stand for the healthy subjects group, and (G,H) stand for the CAS group; P6 represents CD11a+/CD45+ LMP, Q1&P6 represents CD45+ LMP, Q4&P6 represents CD11a+ LMP, P8 represents CD31+/CD42b+ PMP and Q1-1 represents CD31+/CD42b− EMP. P5 represents the quantity of micro bead standard. Values are shown as median [25th–75th percentile]. *p < 0.05, **p < 0.01 vs. healthy subjects.

