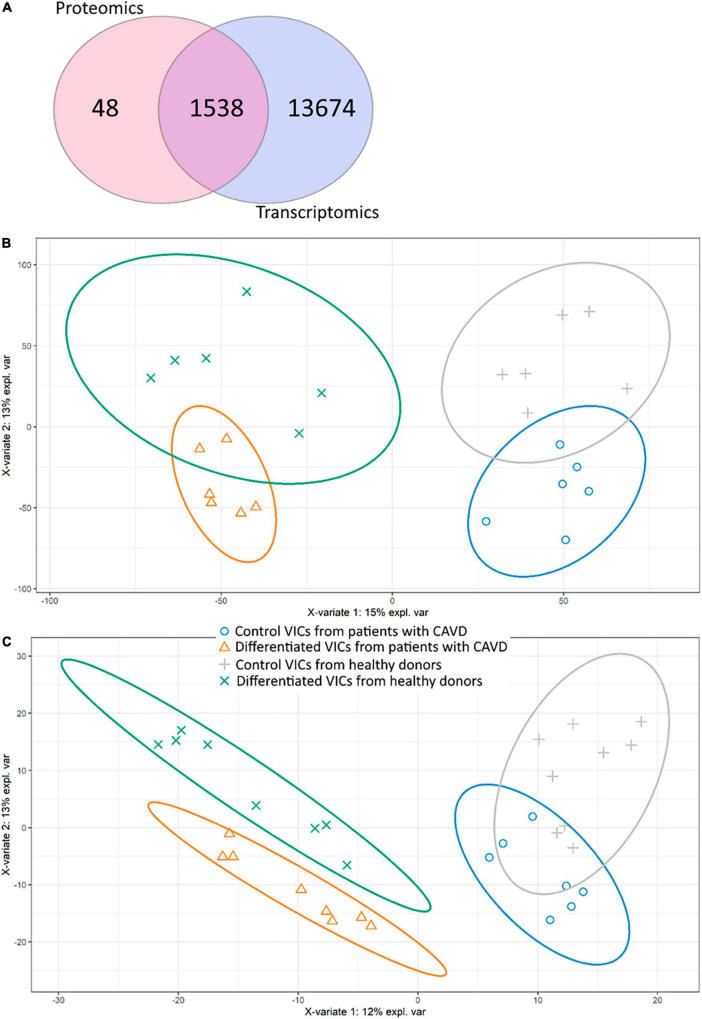
FIGURE 1.
Comparison of proteomic and transcriptomic profiles of human valve interstitial cells (VIC) from patients with or without calcific aortic valve disease (CAVD) in standard cultivation (control) and in osteogenic medium (differentiated). (A) Venn diagram shows the number of unique gene products identified by shotgun proteomics and RNA-seq transcriptomics. (b-c) Partial least squares-discriminant analysis (PLS-DA) score plots based on transcriptomic (B) and proteomic (C) data. Yellow triangles—differentiated VIC from patients with CAVD, green crosses—differentiated VIC from healthy donors, gray pluses—control VIC from healthy donors, blue circles—control VIC from patients with CAVD.

