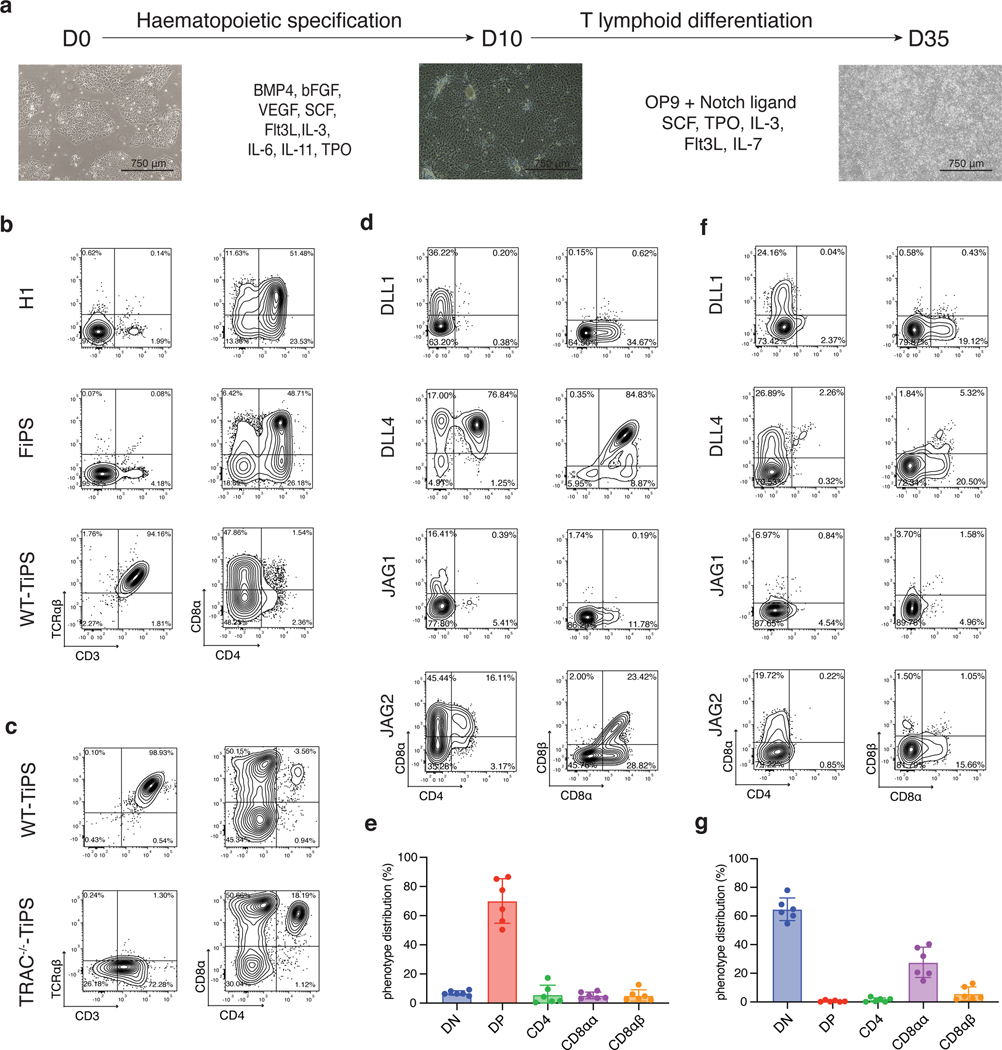
Fig. 1. DLL4 supports in vitro αβTCR-T cell development of WT-TiPS but not CAR-TiPS.
a, Schematic representation of in vitro T cell differentiation protocol. Microscope images are at 4x magnification, scale bar represents 750μm. b, Flow cytometric analysis of T lineage commitment of H1, FiPS and WT-TiPS on OP9-mDLL1, gated on live CD45+CD7+ cells at day 40 (D40) in the differentiation. c, Flow cytometric analysis of T lineage commitment of WT-TiPS and TRAC−/−-TiPS on OP9-mDLL1, gated on live CD45+ cells at D40 in the differentiation. d, f, Representative flow cytometric analysis of T lineage commitment of WT-TiPS (d) and CAR-TiPS (f) on D35 in differentiation on OP9 expressing the indicated human Notch ligand, gated on live CD45+CD7+ cells. e, g, Phenotype distribution of WT-TiPS (e, n = 6 biological replicates) or CAR-TiPS (g, n = 6 biological replicates) on D35 of differentiation on OP9-DLL4, gated on live CD45+CD7+ cells. All data are means ± s.d.

