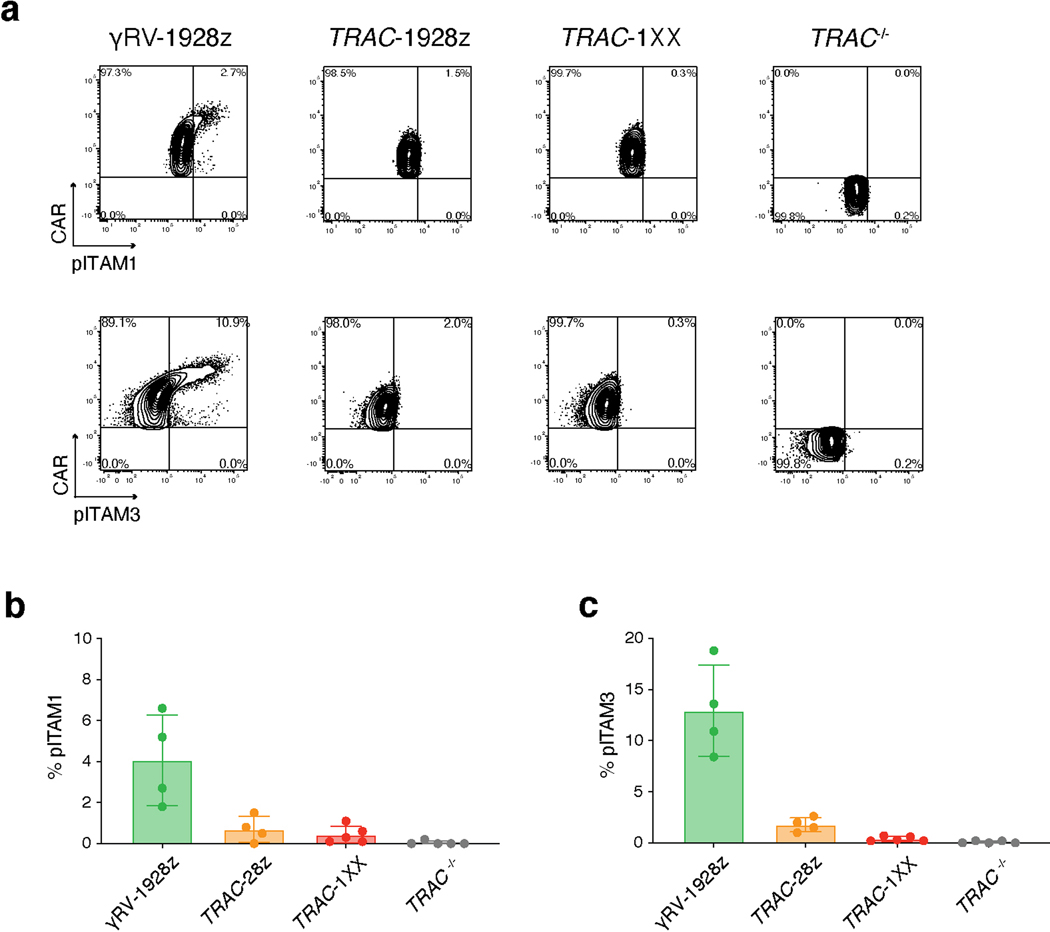
Extended Data Fig. 6. Tonic ITAM phosphorylation in CAR+ T cells.
a, Representative flow cytometry plot of CAR expression and pITAM1 (top panel) or pITAM3 (bottom panel) in PBMC-derived T cells expressing γRV-1928z, TRAC-1928z or TRAC-1XX (gated on live CAR+), or in control TRAC−/− cells (gated on live CAR−). b, c, Percentage of pITAM1+ (b) and pITAM3+ (c) in the populations shown in a (n = 4–5 biological replicates, data are means ± s.d.).

