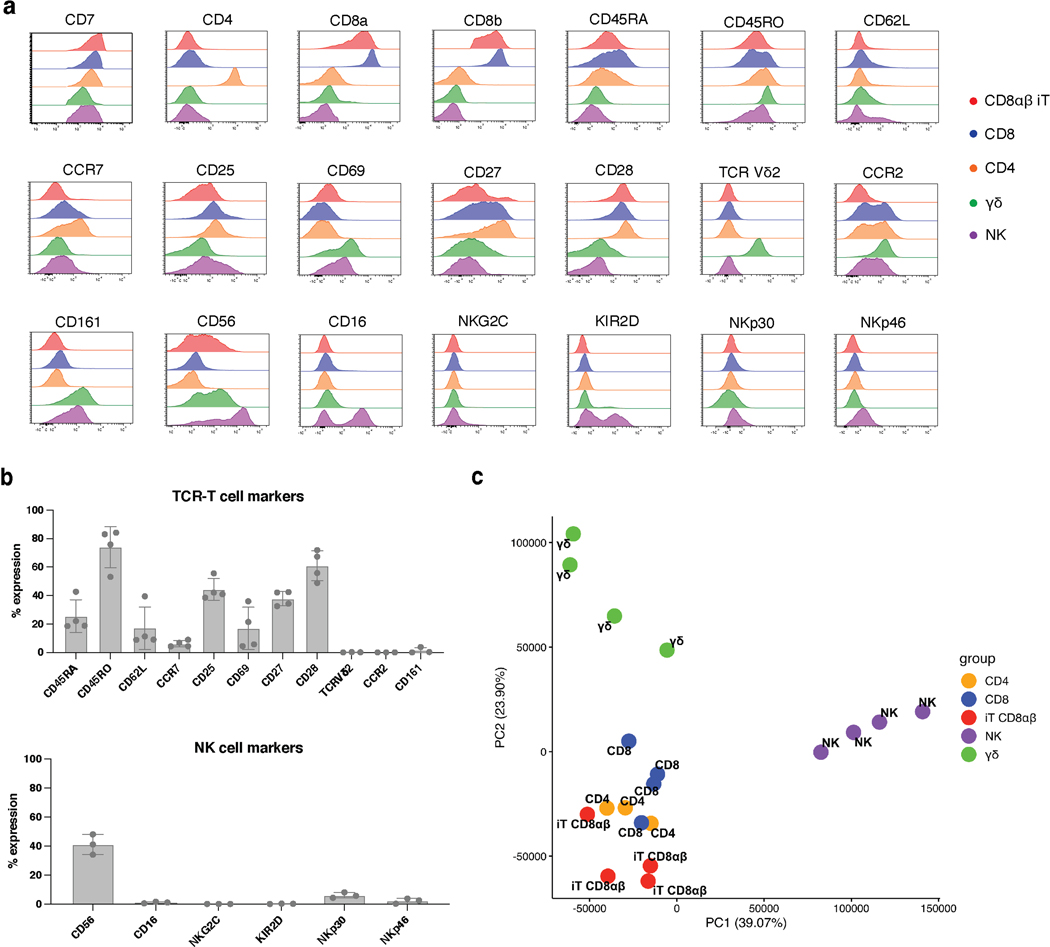
Extended Data Fig. 8. Comparison of CD8αβ TRAC-1XX-iT cells and peripheral blood lymphocytes.
a, Representative examples of lymphoid phenotype marker expression in CD8αβ TRAC-1XX-iT (red), CD8αβ αβTCR-T (blue), CD4 αβTCR-T (orange), γδTCR-T (green) and NK cells (purple). CD8αβ TRAC-1XX-iT cells are the same as represented in Fig. 5a. b, Variability of lymphoid phenotype marker expression in CD8αβ TRAC-1XX-iT cells (n= 3–4 biological replicates, data are means ± s.d). Biological replicates shown are samples utilized in RNA analysis (Fig. 5b, c). c, Principal Component Analysis comparing TRAC-1XX CD8αβ αβTCR-T cells (CD8, n = 4), TRAC-1XX CD4 αβTCR-T cells (CD4, n = 3), γRV-1XX γδTCR-T cells (γδ, n = 4), γRV-1XX NK cells (NK, n = 4) and CD8αβ+ TRAC-1XX-iT cells (iT CD8αβ, n = 4).

