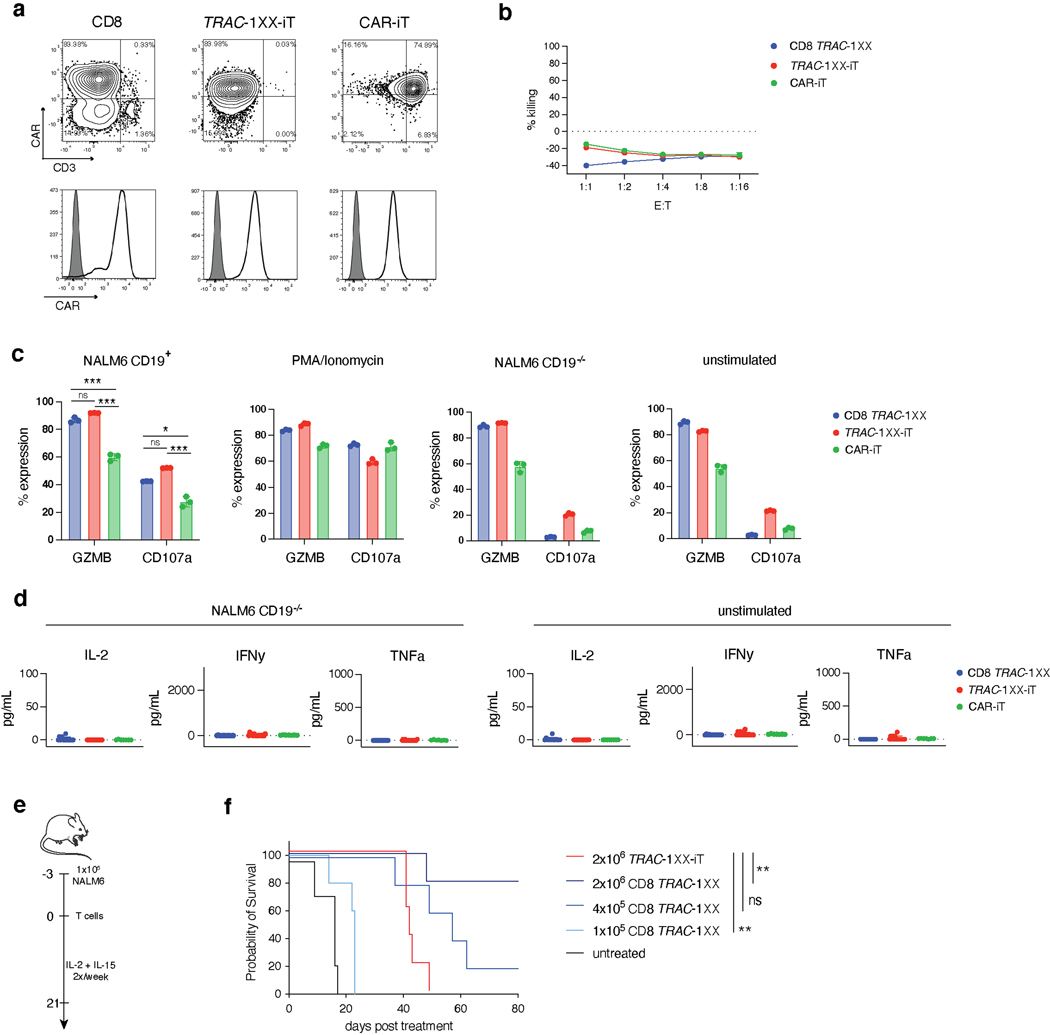
Extended Data Fig. 9. Functional comparison of TRAC-1XX-iT, CAR-iT and CD8 TRAC-1XX.
Functional comparison of healthy-donor peripheral blood TRAC-1XX CD8αβ αβTCR-T (CD8 TRAC-1XX), CAR-iT and TRAC-1XX-iT cells. CD8 TRAC-1XX cell doses represent number of CAR+ cells utilized in the assay. a, CAR and CD3 expression in CD8 TRAC-1XX, CAR-iT and TRAC-1XX-iT cells (black line) compared to unstained control (grey filled histogram). b, 18 h incucyte cytotoxicity assay with NLR+ CD19−/− NALM6 target cells (n = 3 technical replicates). c, 4 h intracellular cytokine detection in T cells stimulated with NALM6 CD19+ target cells (at a 1:1 E:T), PMA/Ionomycin, NALM6 CD19−/− target cells (at a 1:1 E:T) unstimulated controls (n = 3 technical replicates). d, 24 h cytokine secretion using NALM6-CD19−/− as target cells at a 1:1 E:T (n = 11–18 biological replicates, left panel) or unstimulated control (n = 11–18 biological replicates, right panel). e, Schematic representation of the NALM6 in vivo tumour model. f, Kaplan-Meier analysis of tumour free survival (2×10⁶ TRAC-1XX-iT vs 2×10⁶ CD8 TRAC-1XX p=0.0062, 2×10⁶ TRAC-1XX-iT vs 1×10⁵ CD8 TRAC-1XX p=0.0034). * P<0.05, ** P<0.01, *** P<0.001, Chi-Square test (b) log-rank Mantel-Cox test (f). All data are means ± s.d.

