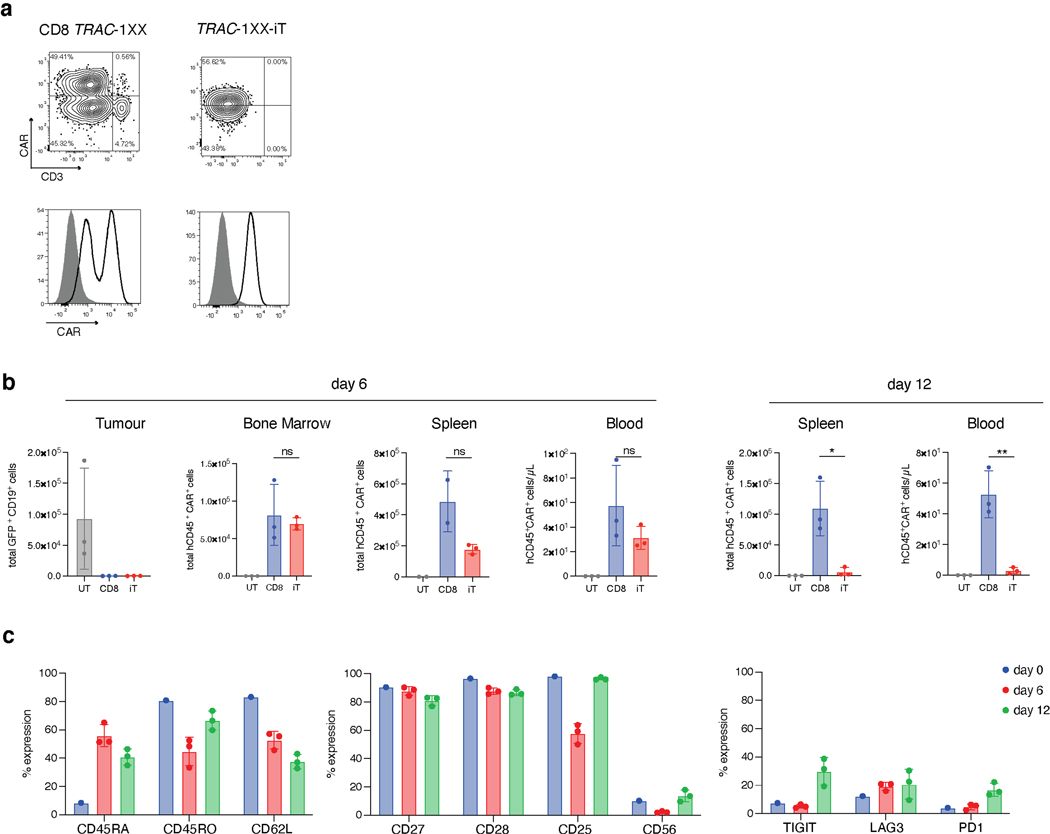
Extended Data Fig. 10. TRAC-1XX-iT function compared to healthy donor peripheral blood-derived CD8 TRAC-1XX T cells.
In vivo functional comparison of healthy-donor peripheral blood TRAC-1XX CD8αβ αβTCR-T (CD8 TRAC-1XX), TRAC-1XX-iT cells. CD8 TRAC-1XX cell doses represent number of CAR+ cells utilized in the assay. a, CAR and CD3 expression in CD8 TRAC-1XX and TRAC-1XX-iT cells (black line) compared to unstained control (grey filled histogram). b, Enumeration of tumour cells in the bone marrow and T cells in bone marrow, spleen and blood 6 or 12 days post T cell infusion (n = 2–3 mice, T cell in bone marrow day 12, CD8 TRAC-1XX vs TRAC-1XX-iT p=0.0161, T cells in spleen day 12 CD8 TRAC-1XX vs TRAC-1XX-iT p=0.0052). c, Phenotype of CD8 cells prior to infusion (day 0, n = 1) and of cells derived from the bone marrow on day 6 (n = 3 mice) and 12 (n = 3 mice). d, Kaplan-Meier analysis of overall survival. * P<0.05, ** P<0.01, *** P<0.001 Welch’s 2-sample two-sided t test (b) All data are means ± s.d.

