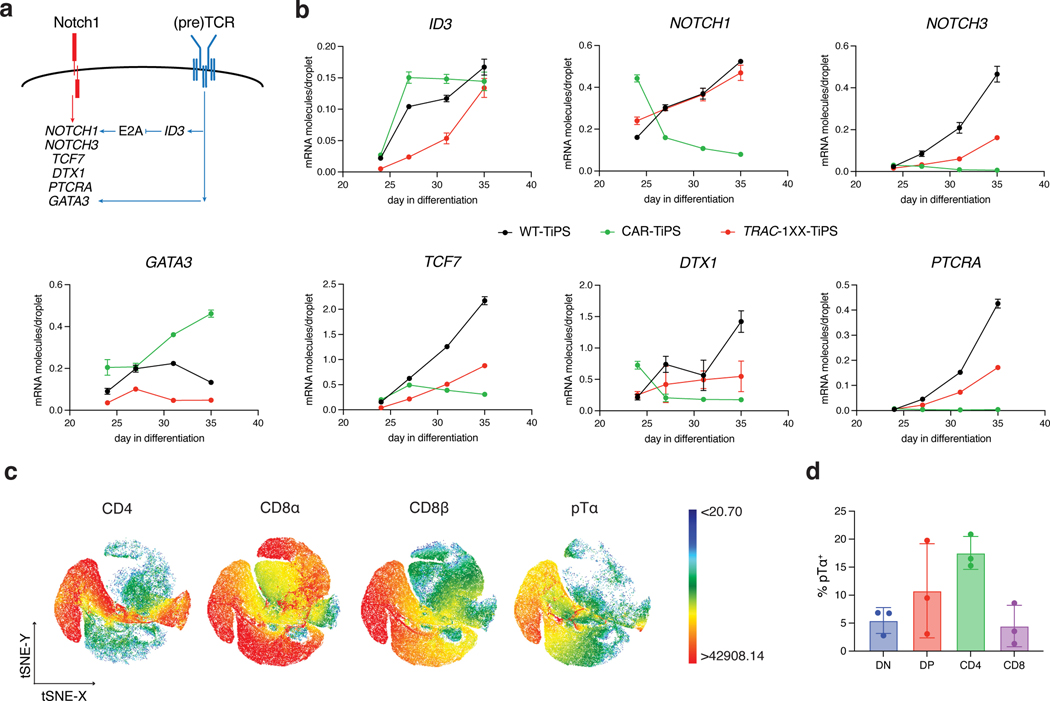
Fig. 3. CAR regulation influences Notch and TCR target gene induction.
a, Schematic representation of Notch and (pre)TCR signalling interactions as reported in the literature. b, ddPCR analysis of Notch and (pre)TCR target genes at D24, 27, 31 and 35 of T cell differentiation (normalized to RPL13A) (n = 3 technical replicates). c, t-distributed Stochastic Neighbour embedding (tSNE) analysis of cell surface expression of CD4, CD8α, CD8β and pTα on D35 TRAC-1XX-TiPS iT cells. Colour scale represent level of marker expression. d, Distribution of pTα expression on D35 TRAC-1XX-TiPS (n = 3 biological replicates). All data are means ± s.d.

