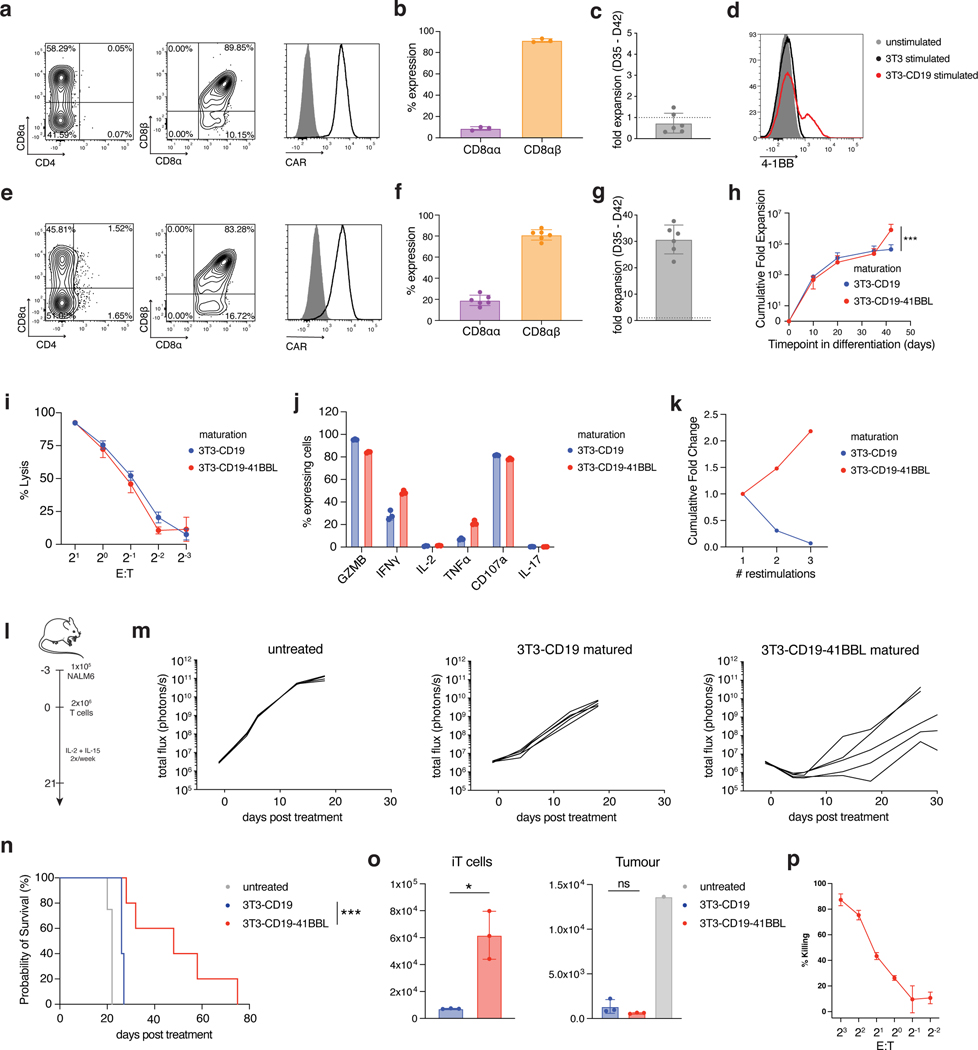
Fig. 4. 4–1BBL co-stimulation enhances CD8αβ TRAC-1XX-iT proliferation and function.
a, Representative phenotype of TRAC-1XX-iT cells matured on 3T3-CD19 for 7 days (D35-D42), gated on live CD45+CD7+ (left and right) and CD45+CD7+CD8α+ (middle). b, Distribution of CD8αα and CD8αβ phenotype in the CD8α+ compartment (n = 3 biological replicates). c, Expansion of TRAC-1XX-iT cells from D35-D42 after maturation on 3T3-CD19 (n = 6 biological replicates). d, 4–1BB cell-surface expression on TRAC-1XX-iT cells on D35 8 h after exposure to parental 3T3 (black), 3T3-CD19 (red) or left unstimulated (grey). e, Representative phenotype of TRAC-1XX-iT cells matured on 3T3-CD19–41BBL, gated on live CD45+CD7+ (left and right) and CD45+CD7+CD8α+ (middle). f, Distribution of CD8αα and CD8αβ phenotype in the CD8α+ compartment (n = 6 biological replicates). g, Expansion of TRAC-1XX-iT cells from D35-D42 after maturation on 3T3-CD19–41BBL (n = 6 biological replicates). h, Total cell expansion from D0-D42 in iT differentiation with maturation on 3T3-CD19±41BBL (n = 6 biological replicates for each group, p=0.0008). i, Cytotoxic activity measured in an 18 h bioluminescence assay, using firefly luciferase (FFLuc)-expressing NALM6 at the indicated effector-to-target (E:T) ratios (n = 3; technical replicates). j, 4 h intracellular cytokine detection of 3T3-CD19±41BBL-matured cells in response to NALM6 (n = 3 technical replicates). k, Representative expansion of D42 cells matured on 3T3-CD19±41BBL upon repeated weekly antigen exposure on 3T3-CD19. l, Schematic representation of NALM6 in vivo tumour model. m, Tumour burden (total flux in photons per second) of NALM6-bearing mice treated with 2×10⁶ D42 TRAC-1XX-iT cells (n = 4–5, line = one mouse). n, Kaplan-Meier analysis of overall survival (p<0.0001). o, Flow cytometric quantification of iT cells (left panel, p=0.0339) and tumour cells (right panel) in bone marrow 6 days after T cell infusion (n = 3). p, Cytotoxic activity measured in a 6 h flow cytometry assay, using primary CD19+ CLL cells at the indicated E:Ts with 3T3-CD19–41BBL-matured TRAC-1XX-iT cells (n = 3 technical replicates) * P<0.05, *** P<0.001, Welch’s 2-sample two-sided t test (h, o), log-rank Mantel-Cox test (n). All data are means ± s.d.

