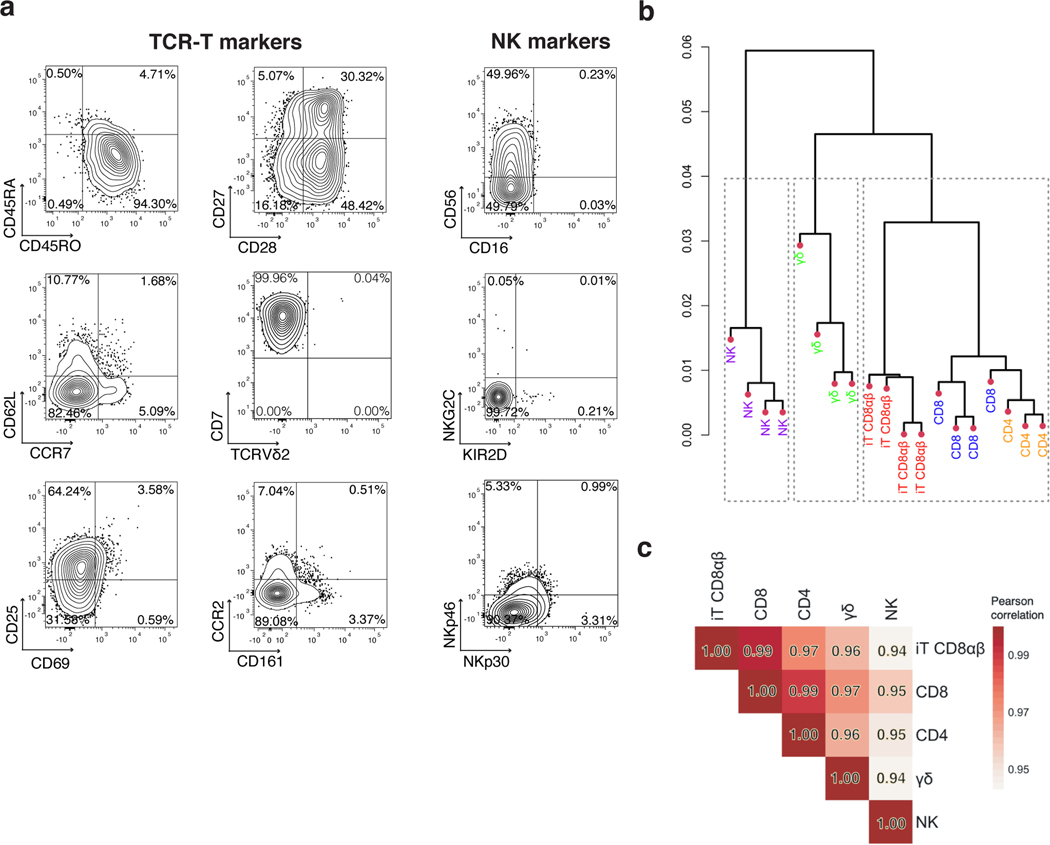
Fig. 5. CD8αβ TRAC-1XX-iT cells resemble peripheral-blood derived CD8αβ T cells.
a, Phenotype analysis of 3T3-CD19–41BBL-matured D42 CD8αβ TRAC-1XX-iT cells for TCR-T cell markers (left and middle panel) and NK-cell markers (right panel). Data is representative of four independent experiments, gated on live CD45+CD7+CD8αβ+ cells. b, Dendrogram of hierarchical clustering analysis based on Euclidian distance matrix comparing the transcriptome of TRAC-1XX CD8αβ αβTCR-T cells (CD8, blue, n = 4 biological replicates), TRAC-1XX CD4 αβTCR-T cells (CD4, orange, n = 3 biological replicates), γRV-1XX γδTCR-T cells (γδ, green, n = 4 biological replicates), γRV-1XX NK cells (NK, purple, n = 4 biological replicates) and CD8αβ+ TRAC-1XX-iT cells (iT CD8αβ, red, n = 4 biological replicates). c, Correlation matrix using Pearson’s statistics comparing same groups as in (b).

