
Figure 1. Fibγ390-396A and FibAEK mice, but not Fib- and FXIII- mice, display significant protection from HFD-induced body weight gain.
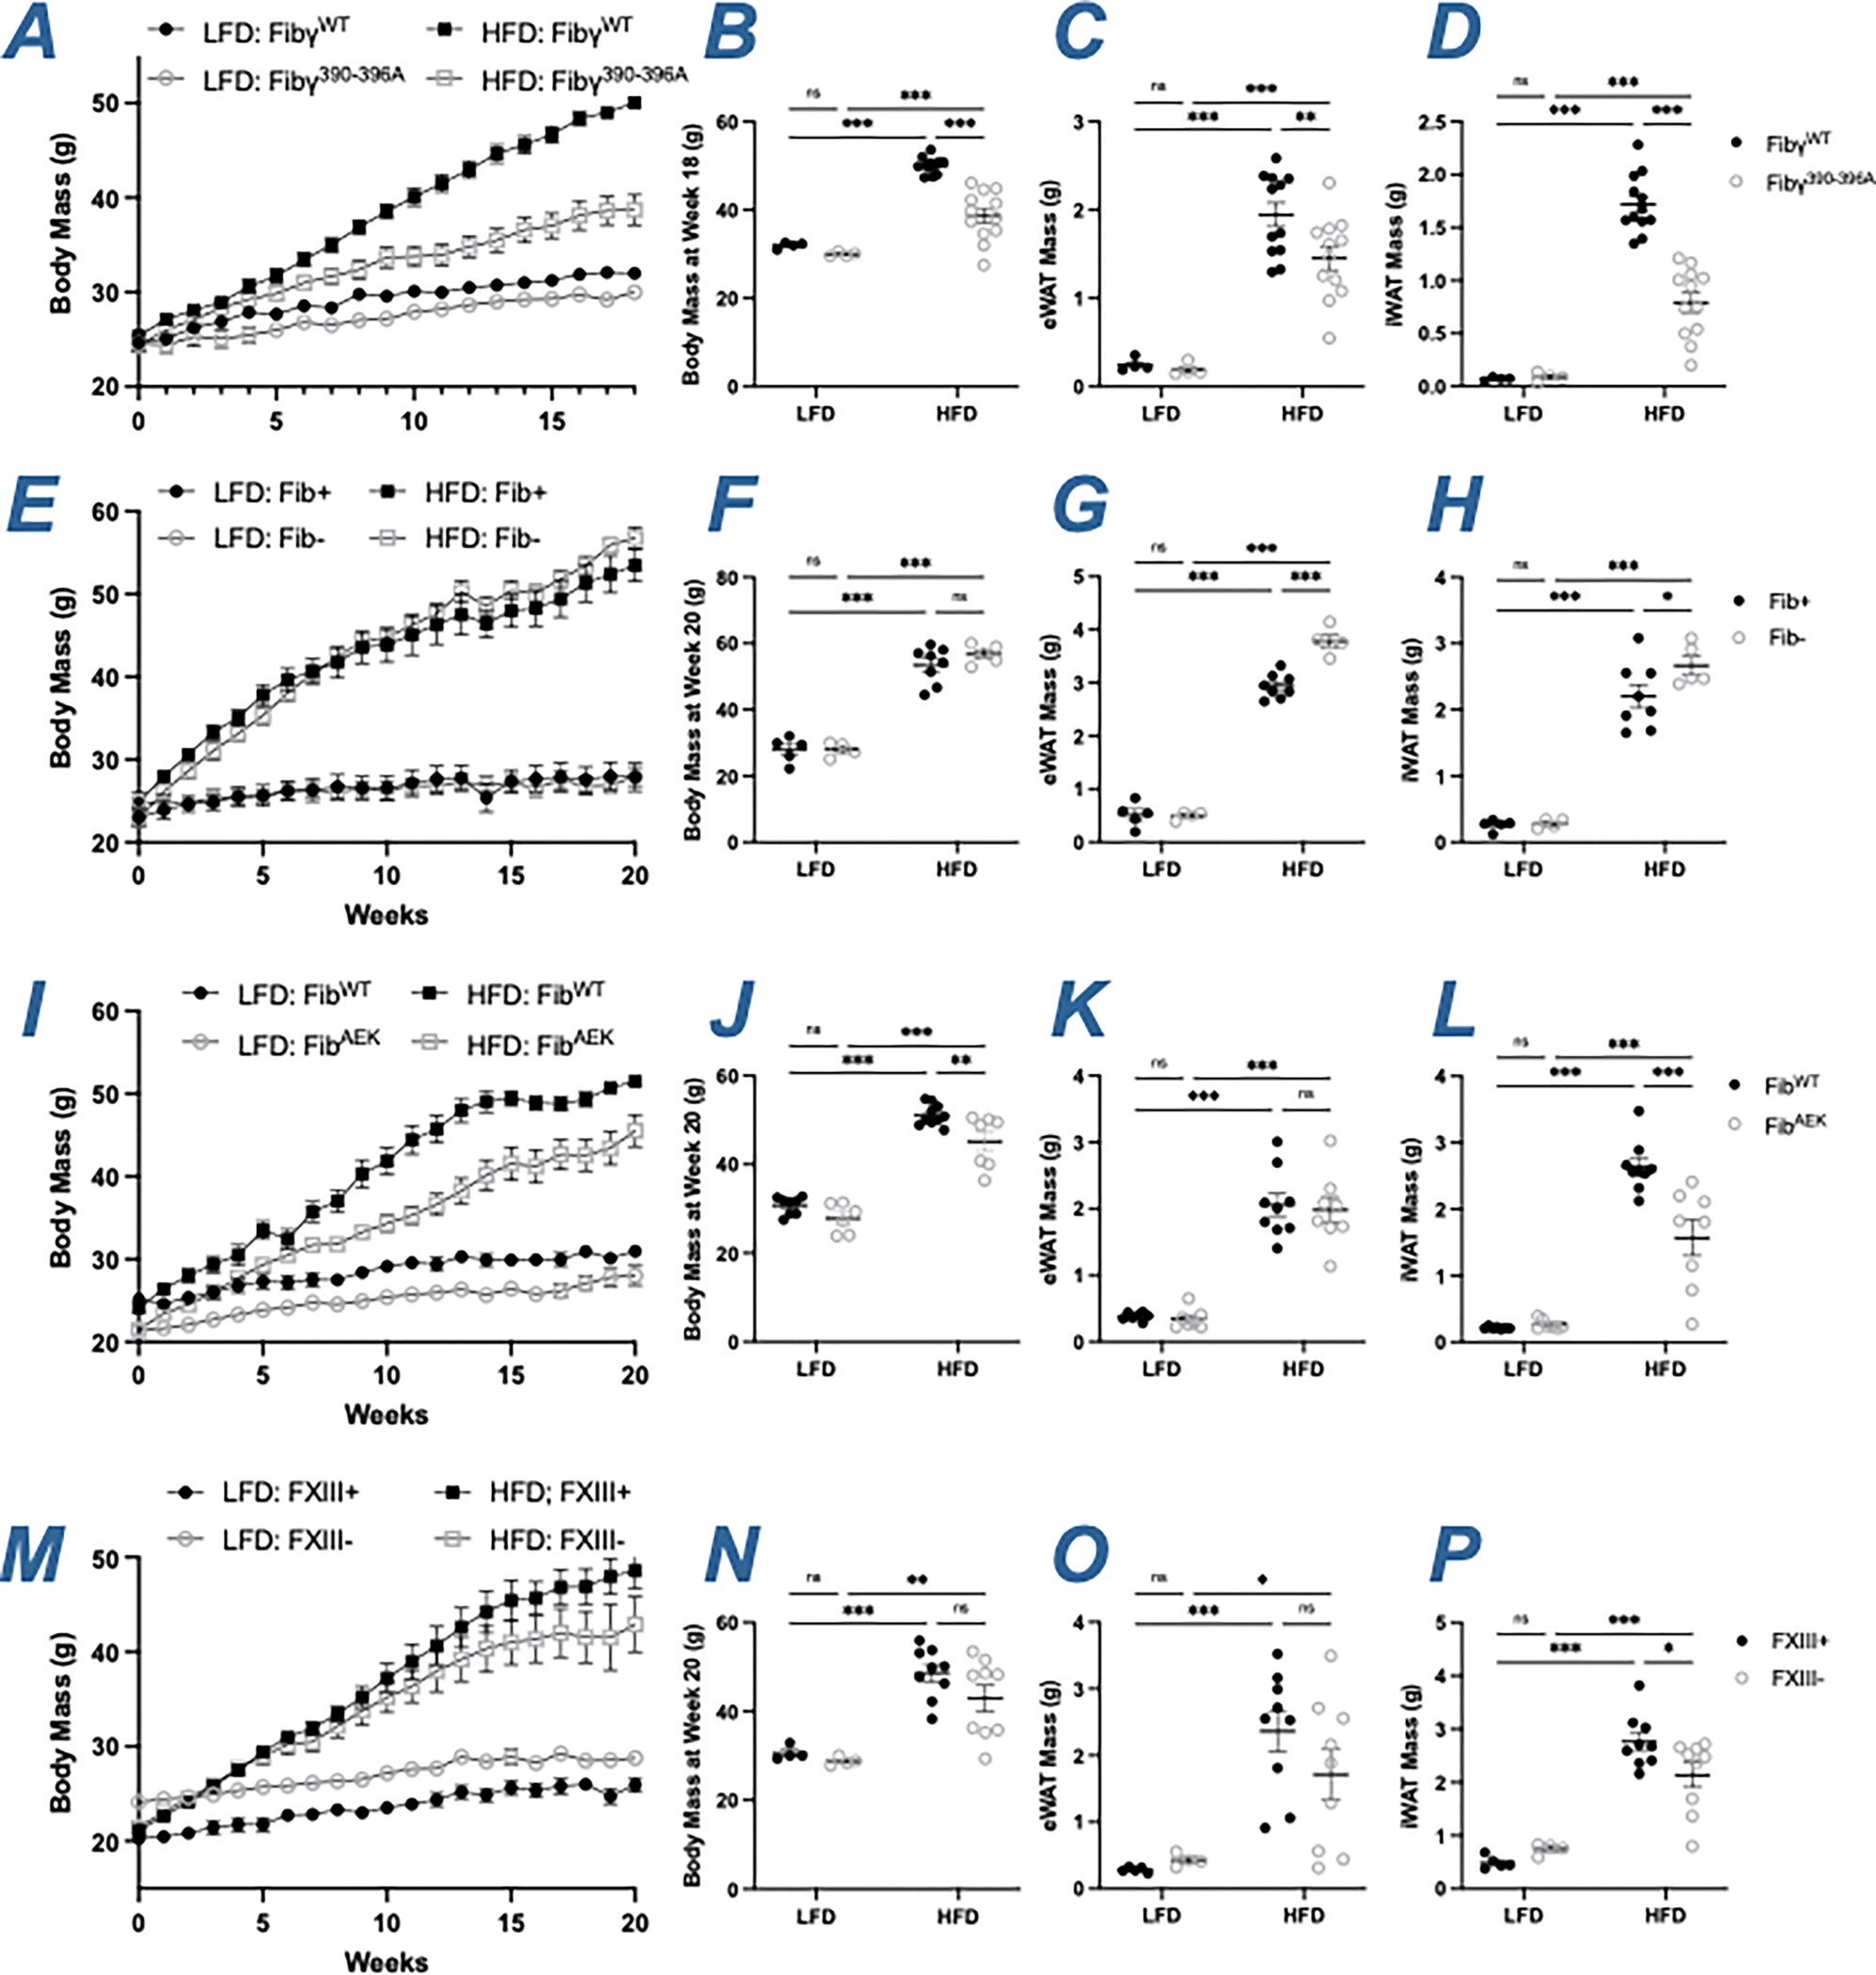
(A) Mean body weight over time of FibγWT and Fibγ390-396A mice. (B) Distribution of body weight for FibγWT and Fibγ390-396A mice after 18 weeks on diet. (C-D) Total fat pad mass of (C) eWAT and (D) iWAT for FibγWT and Fibγ390-396A mice (E) Mean body weight over time of Fib+ and Fib- mice. (F) Distribution of body weight for Fib+ and Fib- mice after 20 weeks on diet. (G-H) Total fat pad mass of (G) eWAT and (H) iWAT for Fib+ and Fib- mice. (I) Mean body weight over time of FibWT and FibAEK mice. (J) Distribution of body weight for FibWT and FibAEK mice after 20 weeks on diet. (K-L) Total fat pad mass of (K) eWAT and (L) iWAT for FibWT and FibAEK mice. (M) Mean body weight over time of FXIII+ and FXIII- mice. (N) Distribution of body weight for FXIII+ and FXIII- mice after 20 weeks on diet. (O-P) Total fat pad mass of (O) eWAT and (P) iWAT for FXIII+ and FXIII- mice. Data are expressed as mean±SEM and analyzed by 2-way ANOVA with Fisher’s LSD test. *P<0.05, **P<0.01, ***P<0.001. LFD: n=4–7; HFD: n=6–12