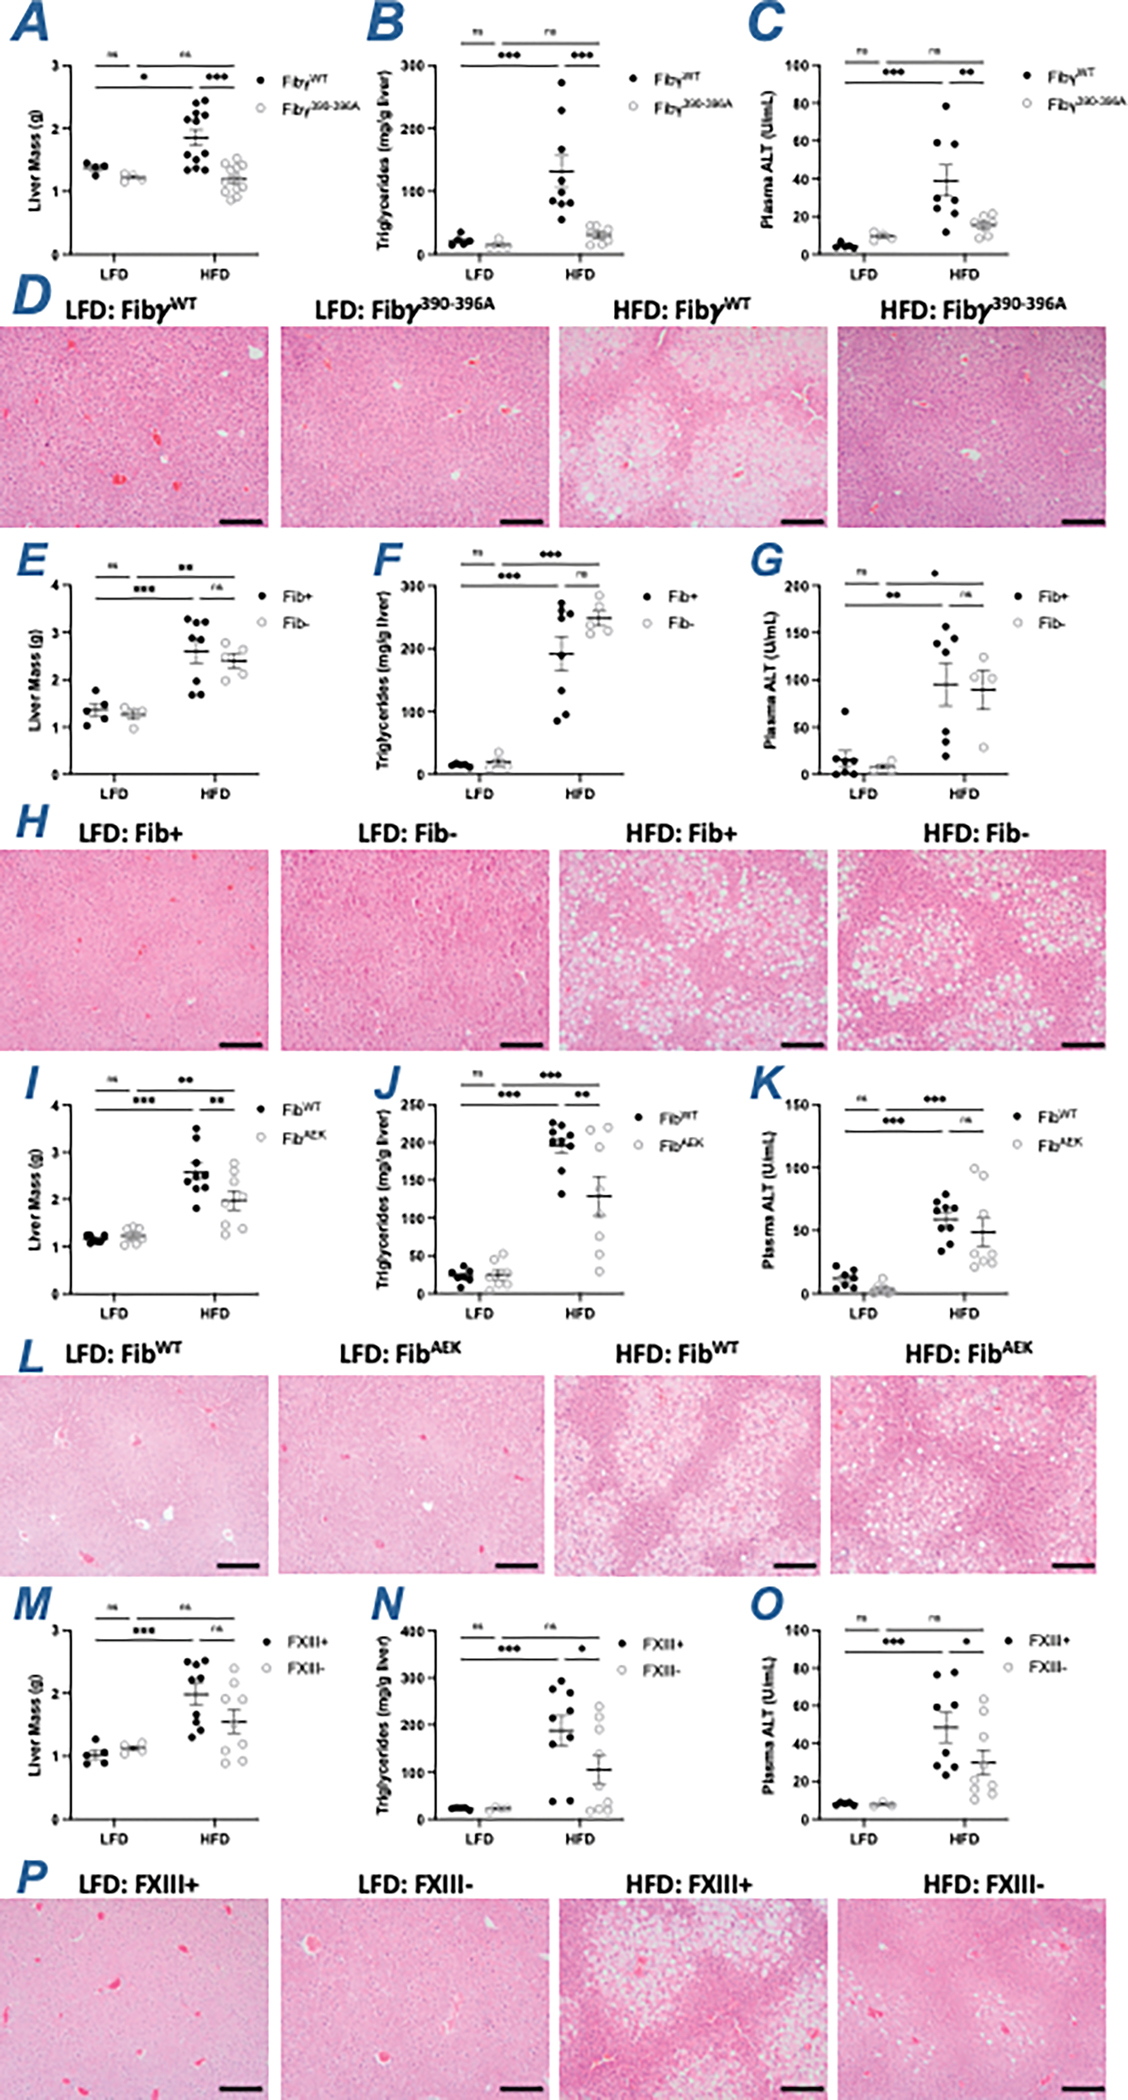
Figure 3. Fibγ390-396A mice are protected, FibAEK and FXIII- mice partially protected, and Fib- mice are not protected from developing NAFLD when challenged with HFD.

(A) Total liver mass, (B) level of hepatic triglyceride and (C) alanine transferase (ALT) activity in plasma of FibγWT and Fibγ390-396A mice. (D) Representative H&E-stained sections of livers isolated from FibγWT and Fibγ390-396A mice. (E) Total liver mass, (F) level of hepatic triglyceride and (G) ALT activity in plasma of Fib+ and Fib- mice. (H) Representative H&E-stained sections of livers isolated from Fib+ and Fib- mice. (I) Total liver mass, (J) level of hepatic triglyceride and (K) ALT activity in plasma of FibWT and FibAEK mice. (L) Representative H&E-stained sections of livers isolated from FibWT and FibAEK mice. (M) Total liver mass, (N) level of hepatic triglyceride and (O) ALT activity in plasma of FXIII+ and FXIII- mice. (P) Representative H&E-stained sections of livers isolated from FXIII+ and FXIII- mice. Magnification: 20X. Scale bar: 40 μm. Data are expressed as mean±SEM and analyzed by 2-way ANOVA with Fisher’s LSD test. *P<0.05, **P<0.01, ***P<0.001. LFD: n=4–7; HFD: n=6–12
