
Figure 7. Fibγ390-396A, FibAEK and FXIII- mice, but not Fib- mice, have smaller BAT than control mice following HFD-challenge.
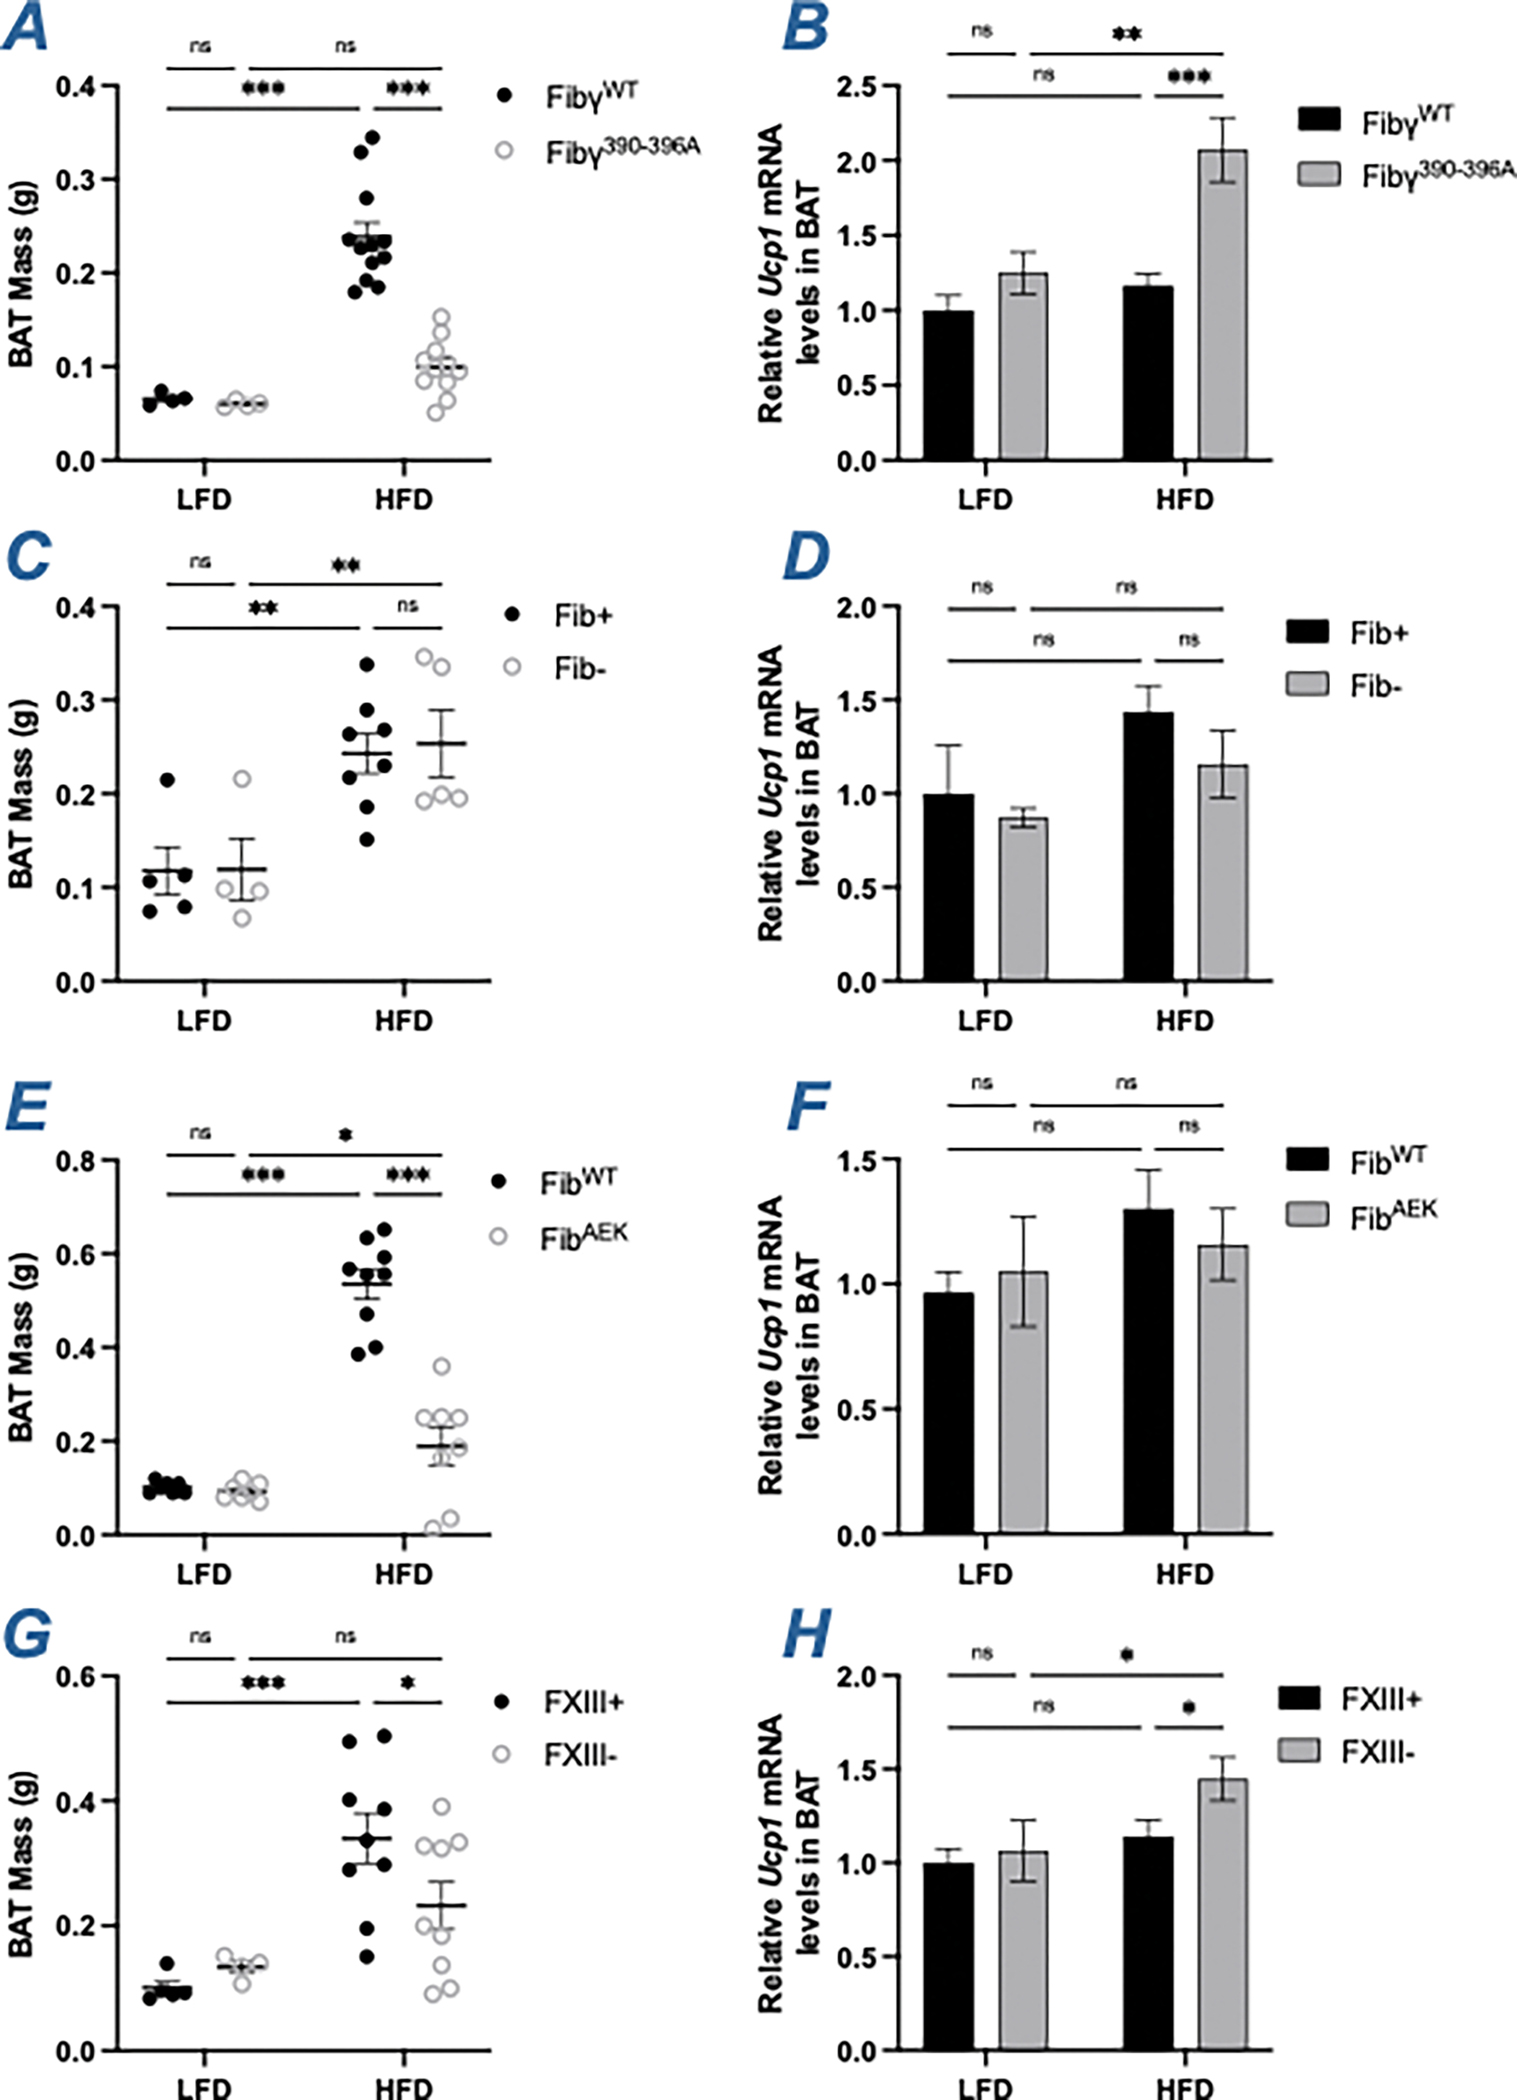
(A) Brown adipose tissue (BAT) mass of FibγWT and Fibγ390-396A mice. (B) Levels of mRNA in the BAT for uncoupling protein (UCP)-1 (Ucp1) of FibγWT and Fibγ390-396A mice. (C) BAT mass of Fib+ and Fib- mice. (D) Levels of mRNA in the BAT for Ucp1 of Fib+ and Fib- mice. (E) BAT mass of FibWT and FibAEK mice. (F) Levels of mRNA in the BAT for Ucp1 of FibWT and FibAEK mice. (G) BAT mass of FXIII+ and FXIII- mice. (H) Levels of mRNA in the BAT for Ucp1 of FXIII+ and FXIII- mice. Data are expressed as mean±SEM and analyzed by 2-way ANOVA with Fisher’s LSD test. *P<0.05, **P<0.01, ***P<0.001. LFD: n=4–7; HFD: n=5–12