
Figure 2: Characterization of the OFF VIPER CAR.
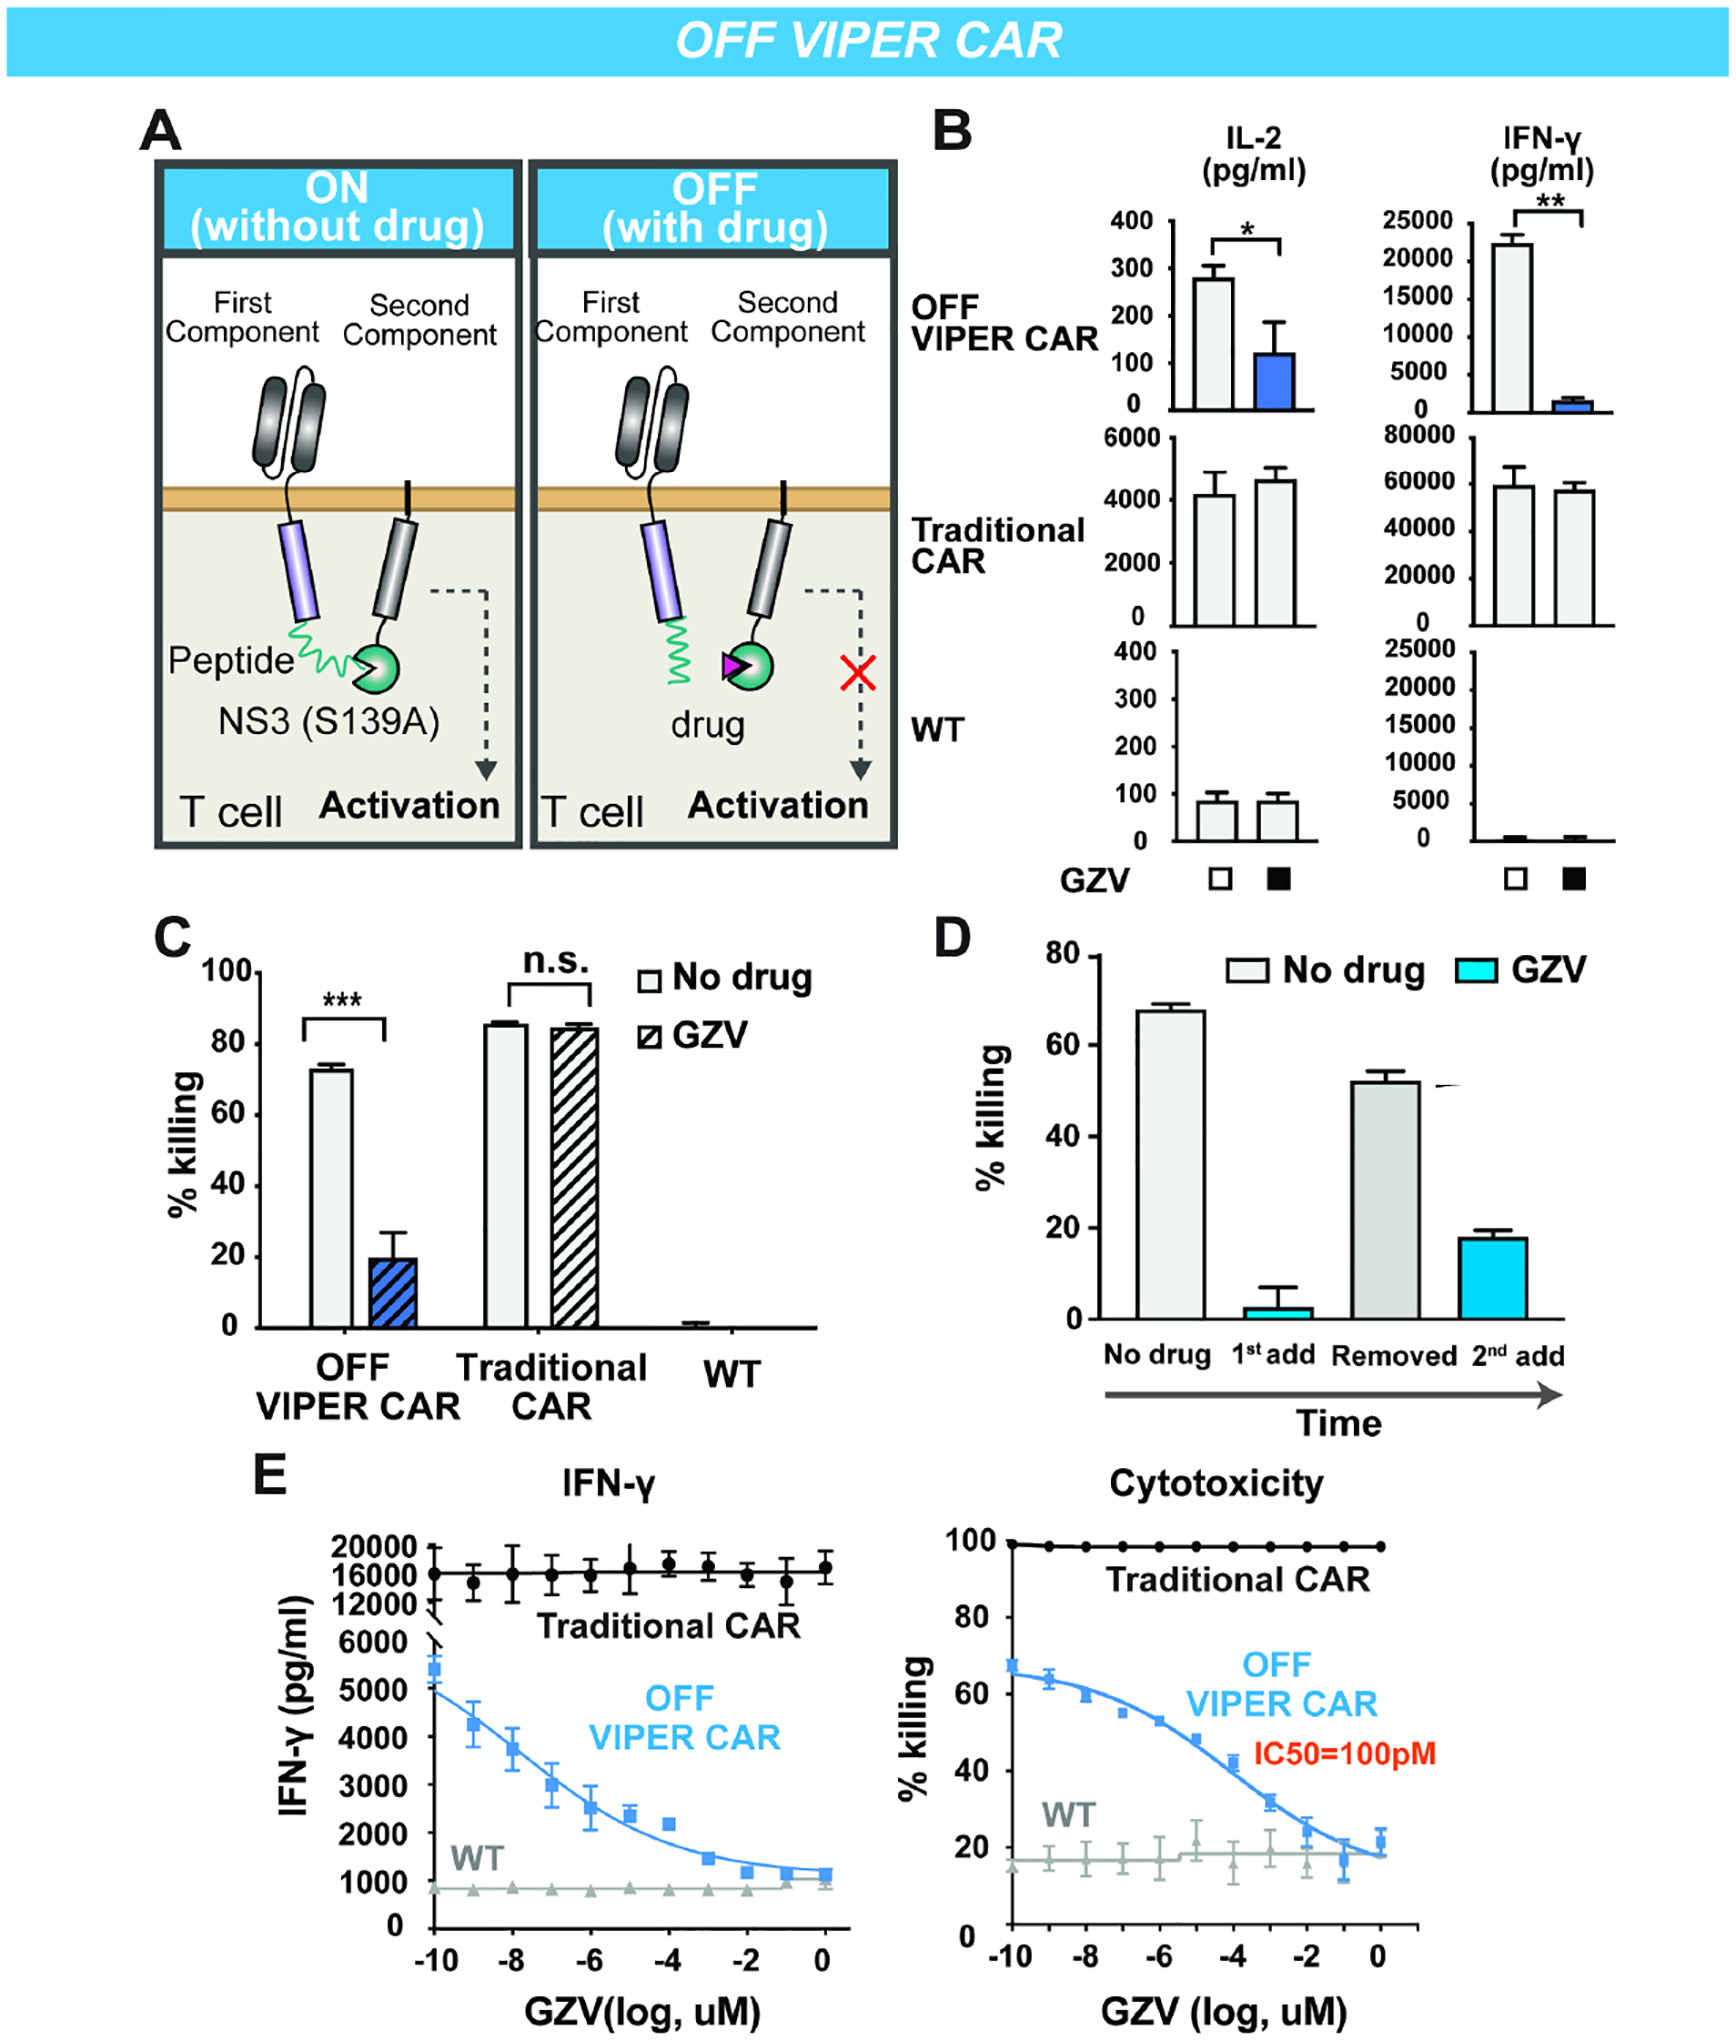
A) Schematic of the OFF VIPER CAR mechanism. B) Primary T cell lines were treated with or without GZV (all in the presence of target cells), and cytokine levels quantified (mean ± s.d., n = 3, *P < 0.05, **P < 0.01 and ***P < 0.001). C) Comparison of cytotoxicity levels of the OFF VIPER CAR with traditional CAR and wild-type cells (mean ± s.d., n = 3, *P < 0.05, **P < 0.01 and ***P < 0.001). D) Cytotoxicity response of OFF VIPER CAR T cells to GZV being added, washed out, and re-introduced after two days (mean ± s.d., n = 3). E) GZV dose-response profile of various cells, as measured in cytokine levels and cell killing (mean ± s.d., n = 3). E:T ratio at 1:1.