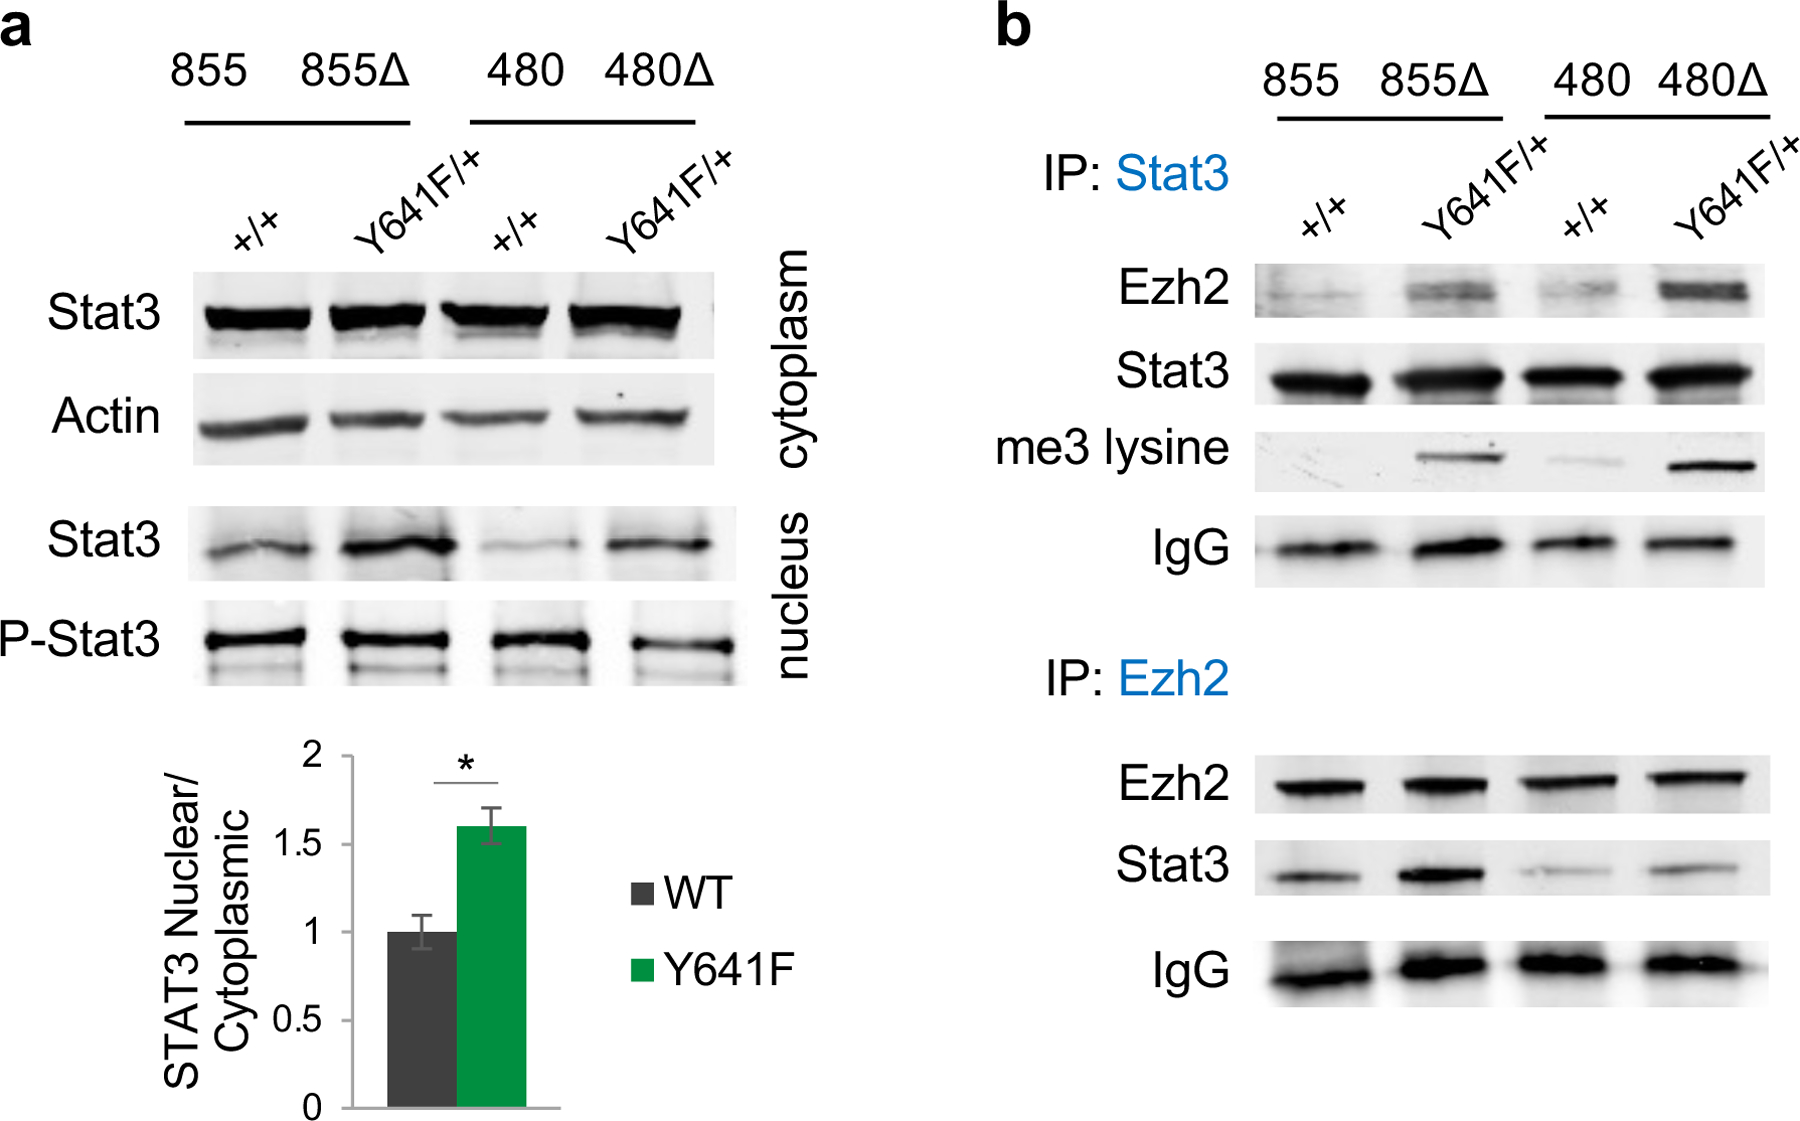
Figure 2. Stat3 co-immunoprecipitates with Ezh2 in Ezh2Y641F mutant cells and is hypermethylated.

(a) Top: Representative image of immunoblotting analysis for Stat3 and actin in the cytoplasm, and Stat3 and phospho-Stat3 in the nucleus of mouse melanoma cell lines 480 and 855 (Δ = Y641F mutant). The bar graph represents quantification of the Stat3 nuclear/cytoplasmic ratio and is plotted as average ± SD (N = 4/group, p = 0.051).
(b) Immunoprecipitation for Stat3 and Ezh2, immunoblotted for Stat3, Ezh2, and tri-methylated lysine.
