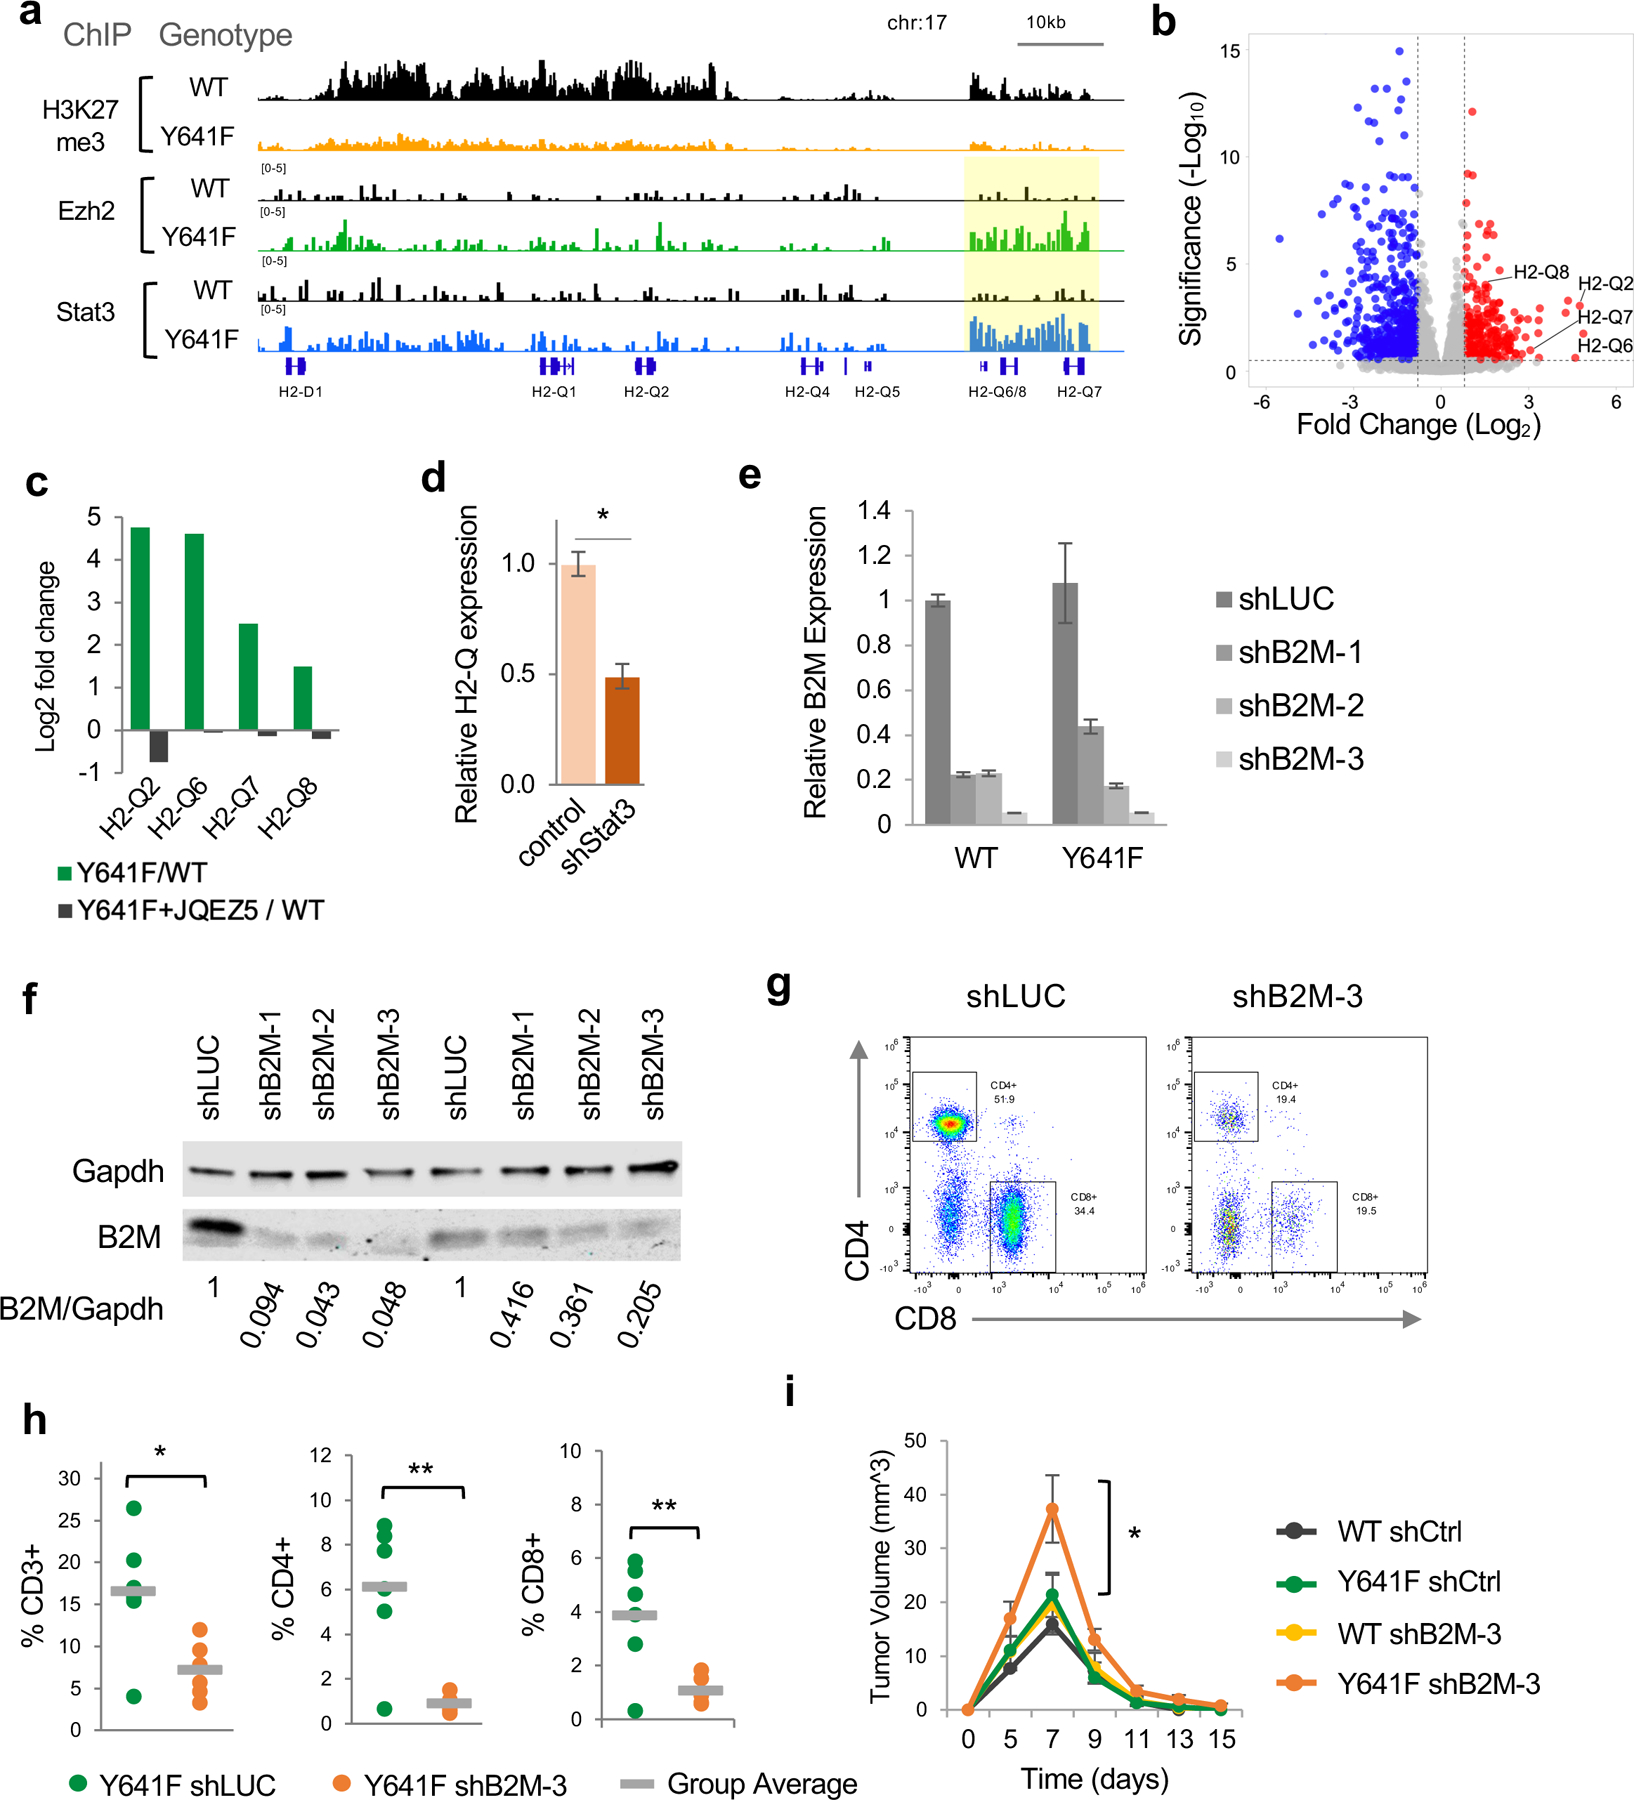
Figure 5. Direct regulation of MHC Class 1b H2-Q genes by Ezh2 and Stat3.

(a) ChIP-seq tracks for H3K27me3, Ezh2 and Stat3 at the H2-Q locus on chromosome 17.
(b) Volcano plot of differential gene expression in Ezh2Y641F vs Ezh2WT melanoma cells, highlighting upregulation of multiple H2-Q genes.
(c) Ratio of expression of H2-Q genes between Ezh2Y641F/Ezh2WT in vehicle vs cells treated with the Ezh2 inhibitor JQEZ5 (p adj<0.01).
(d) Expression of H2-Q genes after Stat3 knockdown in Ezh2Y641F melanoma cells (*p<0.01).
(e) Relative expression of B2M by quantitative PCR after shRNA knockdown using three different shRNAs (N = 3/group). shRNA against luciferase used as control.
(f) Knockdown efficiency confirmed by immunoblotting for B2M for WT (left) and Y641F (right) cell lines. Ratio of B2M/Gapdh shown at the bottom of the blots.
(g) Representative plots of CD4 and CD8 expression in tumor-infiltrating immune cells from Ezh2Y641F tumors. shLUC was used as a control shRNA targeting luciferase.
(h) Analysis of tumor-infiltrating lymphocytes in Ezh2Y641F tumors by flow cytometry using antibodies for CD3, CD4, and CD8 (N = 6/group, *p<0.05, **p<0.01).
(i) Tumor volume over time for Ezh2WT and Ezh2Y641F melanoma cells with B2M knockdown (N = 4–8/group, *p<0.05 for Y641F shB2M-3 vs all other groups at Day 7).
