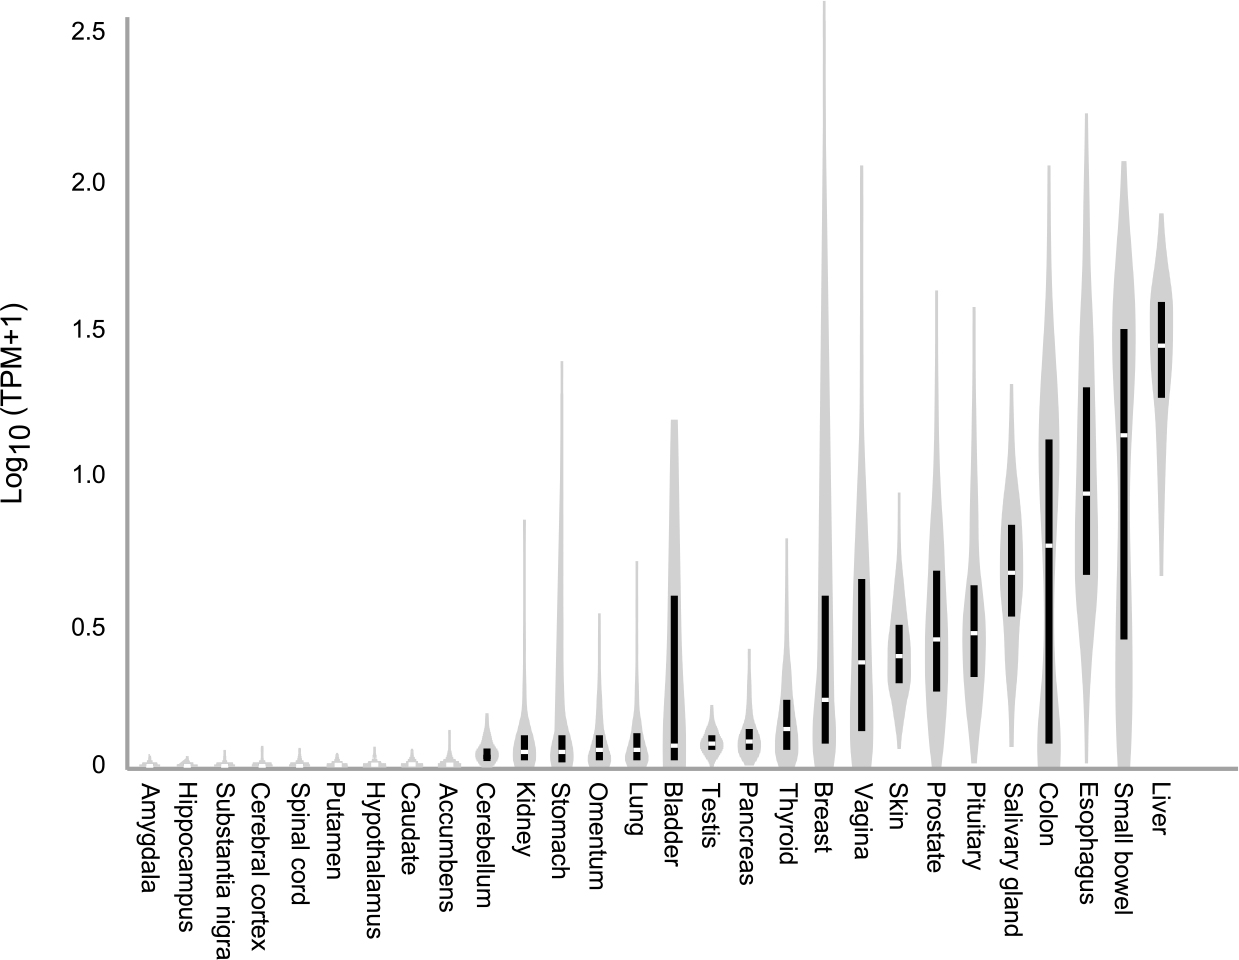
Figure 3.

Distribution of xanthine oxidoreductase in the human body. Data for this figure were obtained from GTEx (V8), a public database containing information from ~1000 normal people regarding the relative expression of all known genes across 54 tissues (www.GTEXportal.org). The vertical black bars show inter-quartile ranges of mRNA levels, with median noted by the break in the bar. The vertical gray shapes provide a visual representation of clustering and spread of all available data. Multiple brain regions tested are shown to the left of the figure, with representative values for other tissues to the right. The highest levels of expression are in the liver, with low or absent levels in almost all areas of the brain. According to the Human Protein Atlas, another public database that provides protein expression levels across 44 human tissues, human brain also does not express detectable XOR protein (www.proteinatlas.com). Abbreviation TPM refers to transcripts per million.
