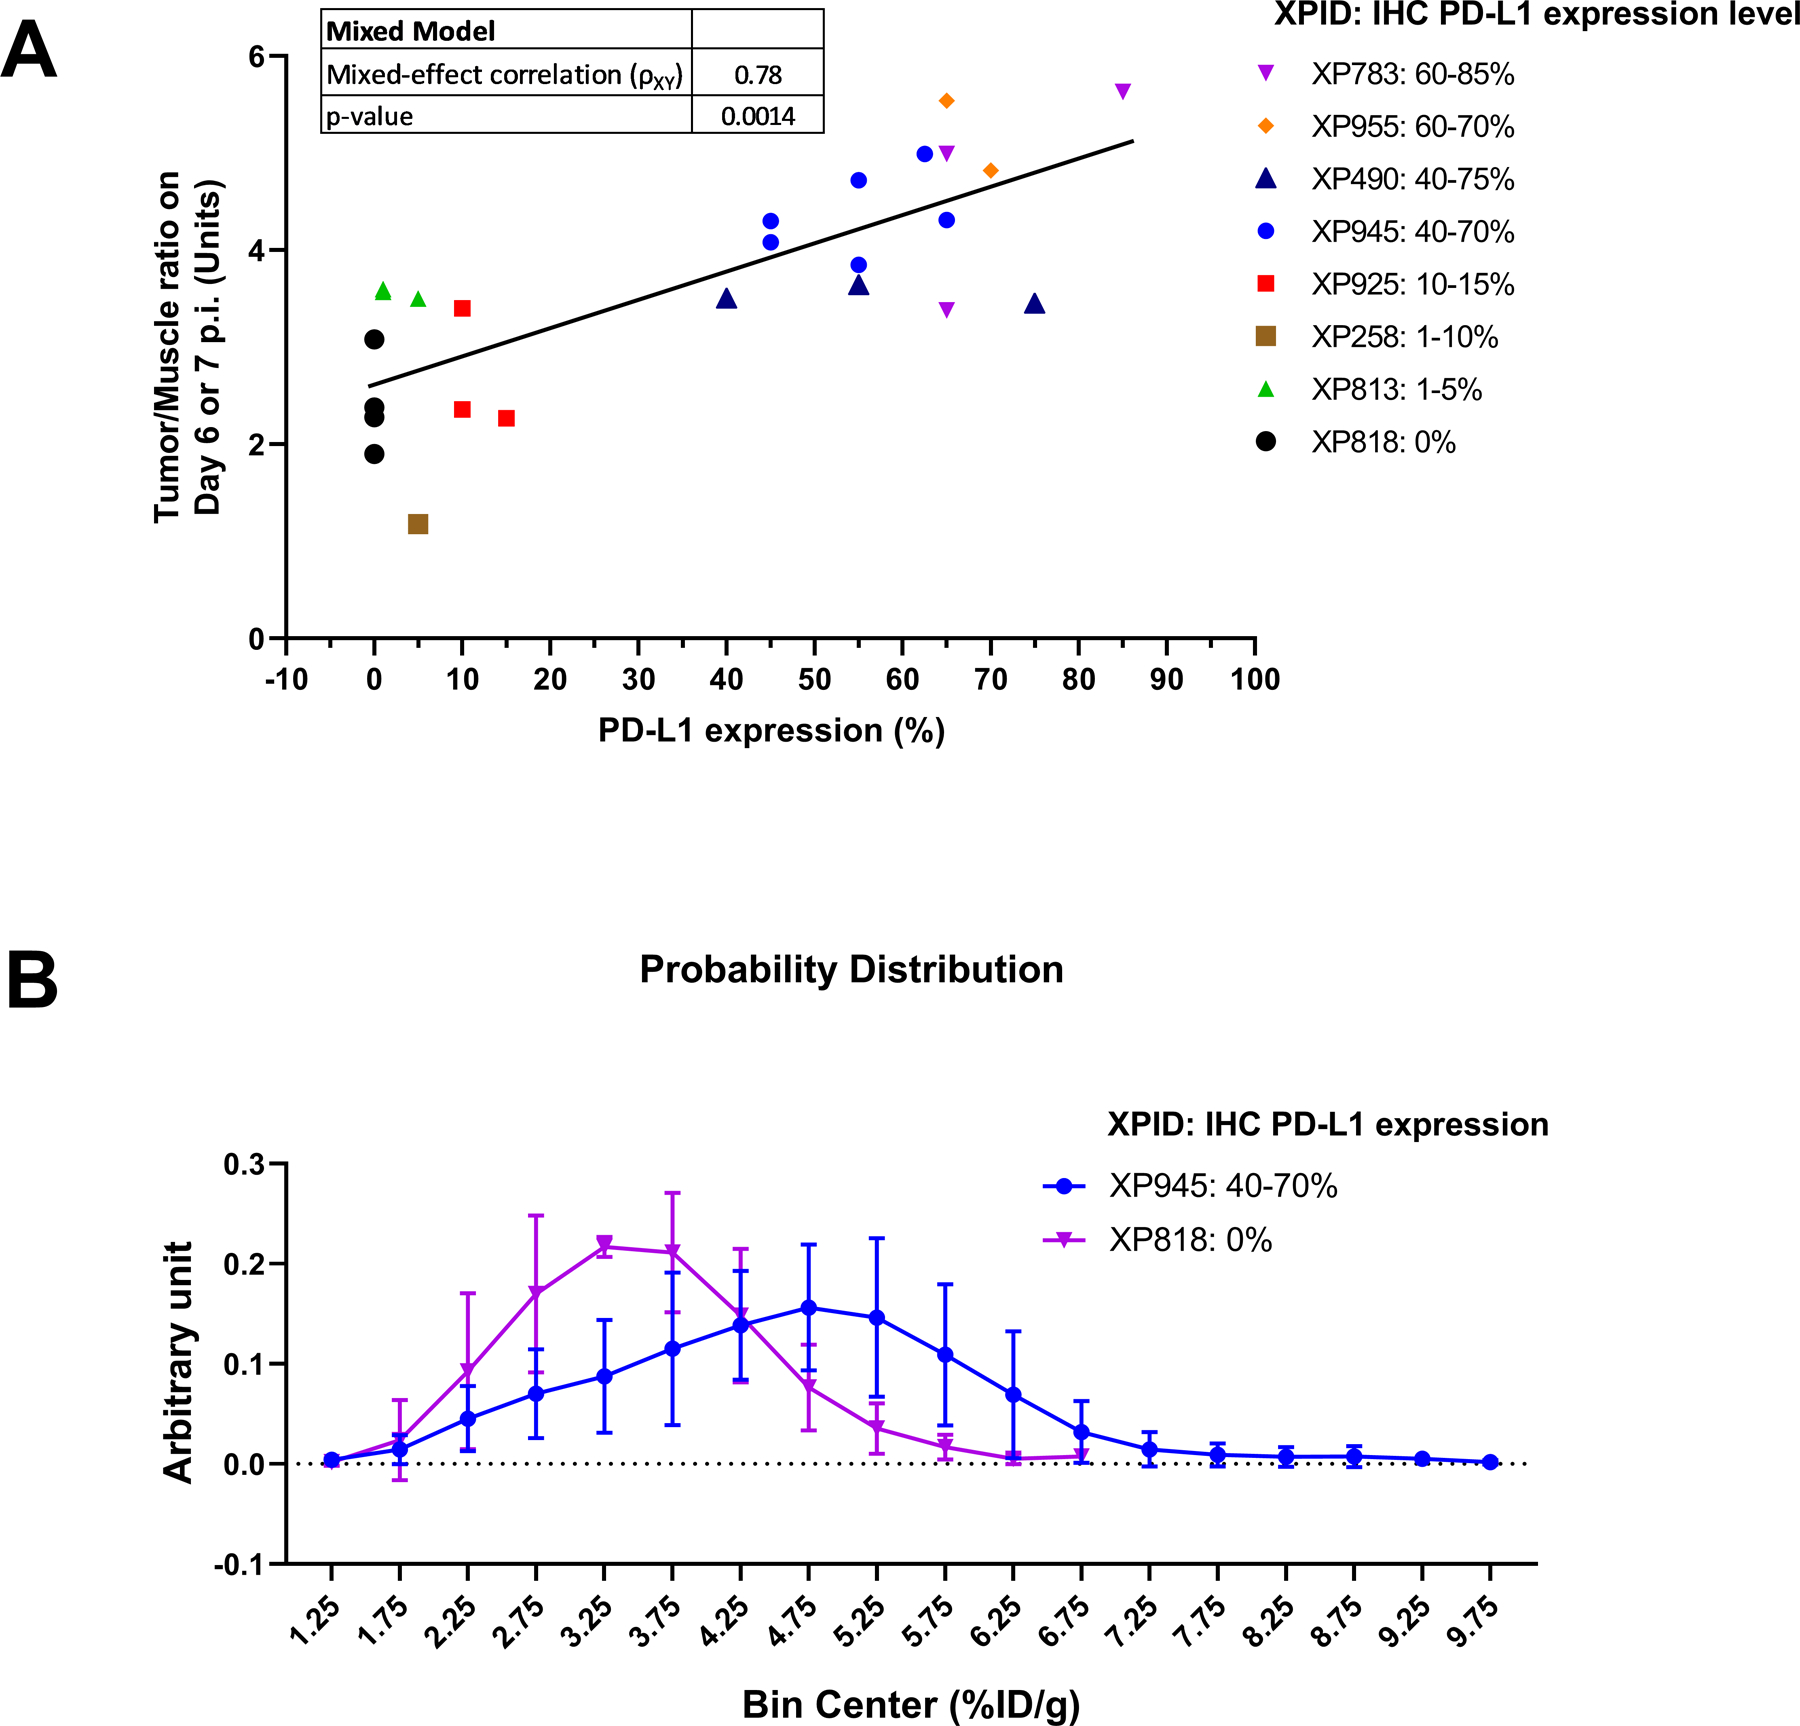
Figure 3. Quantitative immunoPET imaging data analysis.

Panel A: Mixed model statistical analysis of the association between tumor/muscle ratios by immunoPET and PD-L1 expression levels in the corresponding tumors by ex vivo IHC. The model accounts for variations among individual mice within a TG line. The data are from 8 RCC TG lines (25 mice were analyzed using SAS 9.4 with an alpha value of 0.05); ρXY = mixed model correlation. Panel B: Comparative probability distribution analysis of heterogeneous PD-L1 expression in two TG lines: XP945 (40 – 70% PD-L1 IHC, n = 6) vs. XP818 (0% PD-L1 IHC, n = 4). The bin frequency of the distribution histogram was normalized to the total number of immunoPET voxels analyzed. A mixed model analysis was performed to compare the overall difference in tumor uptake voxel distribution between the two TG lines (p = 0.0024). Muscle uptake was included in the model as background signal (non-specific uptake) in each mouse. All data are presented as mean ± s.d.
