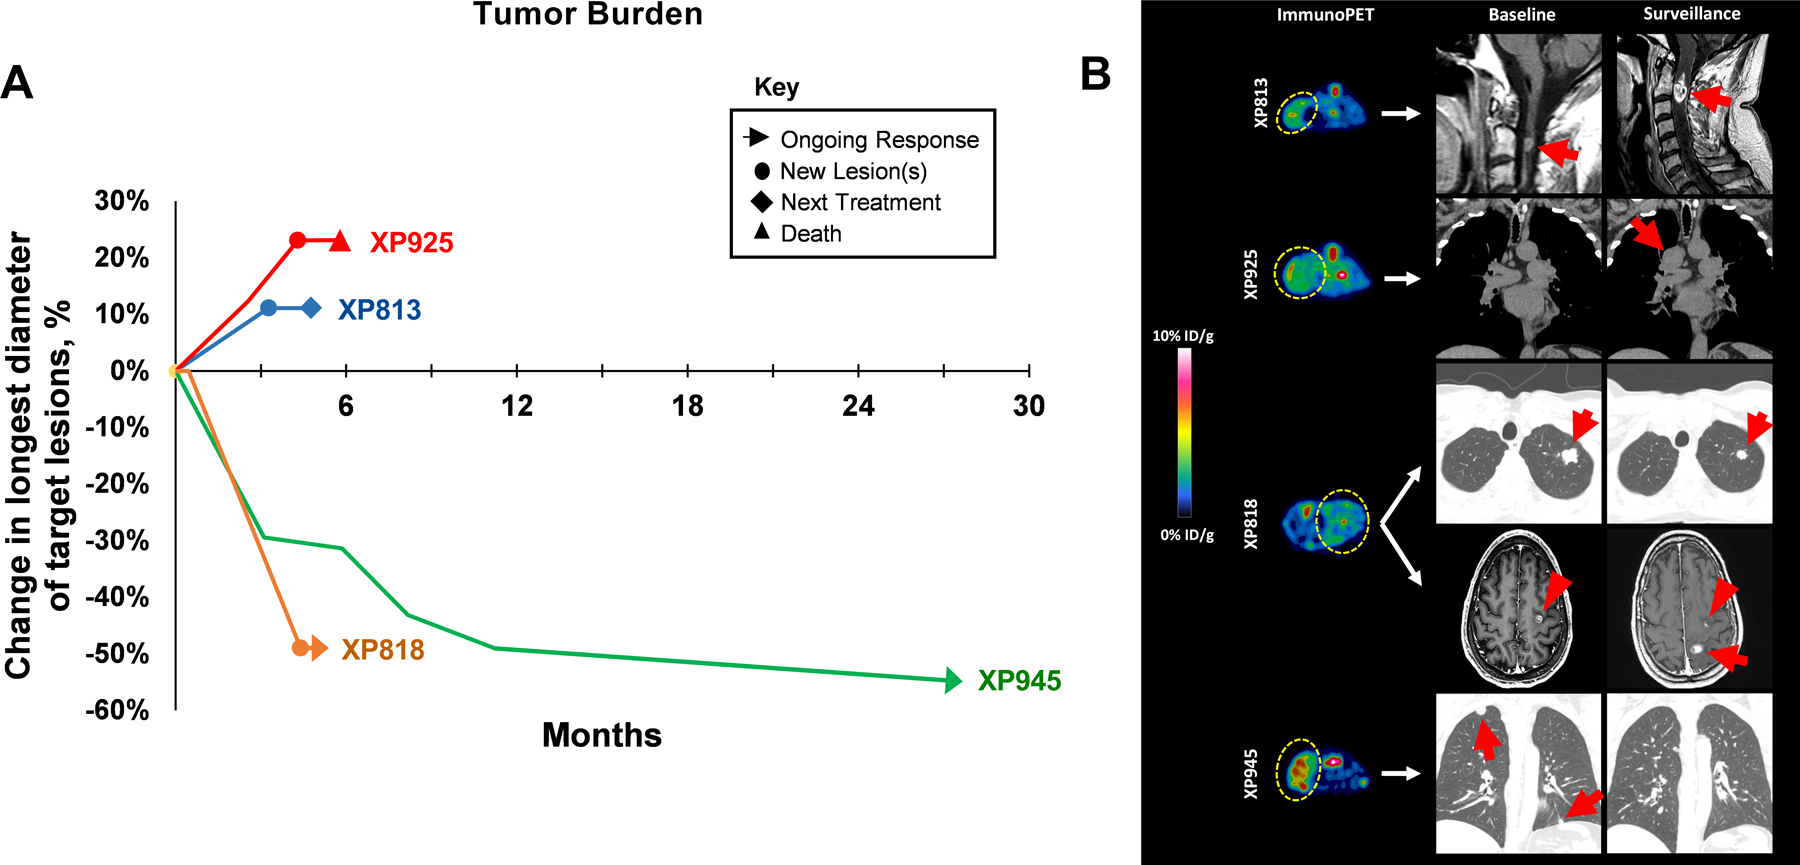
Figure 4. Clinical outcomes to ICI therapy and correlation to PD-L1 expression by immunoPET.

Panel A: Illustration of tumor burden over time after ICI initiation. Tumor burden was determined as the sum of target lesions using RECIST v1.1 principles. Panel B: Representative immunoPET images of TG lines and clinical images from corresponding patients at baseline and on follow-up after ICI. Yellow lassos indicate tumors on PET images and red arrows/arrowheads point to CT/MRI-identified lesions. Patients corresponding to XP813 and XP925 demonstrated progressive disease as best response. Progressive spinal cord lesion shown was subsequently resected and became source of TG line. Patient XP818 had a mixed response, with shrinkage of lung nodules but progression with new brain metastases. Patient XP945 had a lasting partial response (20).
