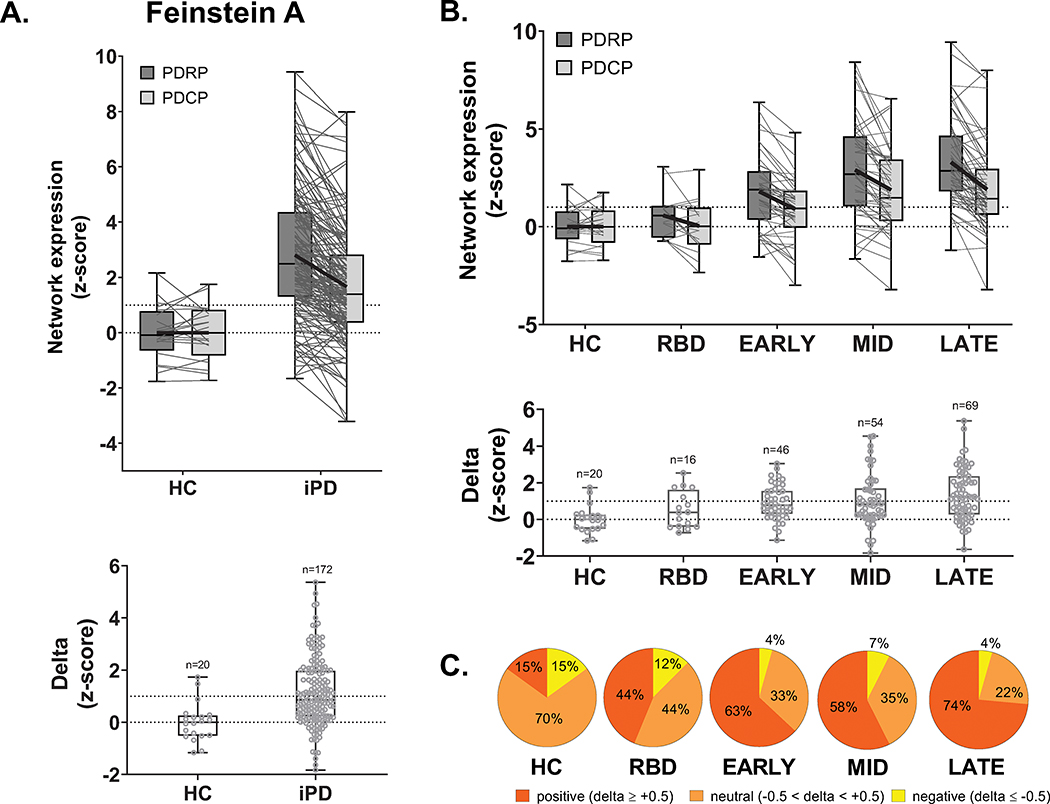
Figure 1. PDRP predominance in idiopathic Parkinson’s disease (iPD): Cross-sectional analysis.
(A) Top: PDRP and PDCP expression values measured in the cross-sectional Feinstein A sample (see text). The gray lines in the box plots connect PDRP and PDCP values measured in each of the subjects. Bold black lines connect mean PDRP and PDCP values for each group. Bottom: The difference between PDRP and PDCP expression values, termed delta, was computed for each subject. (B) Delta values from iPD patients (n=172) were stratified by symptom duration into early (< 4 years; n=46), intermediate (4–8 years; n=54) and late (> 8 years; n=69) subgroups and compared to at risk idiopathic REM sleep behavior disorder (iRBD) (n=16) and age- and gender-matched healthy control (HC) subjects (n=20). Stepwise increases in this measure were seen with longer duration (F4, 200=14.8, p<0.0001; one-way ANOVA). (C) PDRP predominance, measured in each group by the percentage of delta values ≥0.5 (red), likewise increased with advancing disease (z=4.3, p<0.0005, Jonckheere-Terpstra test of trends; see text).

