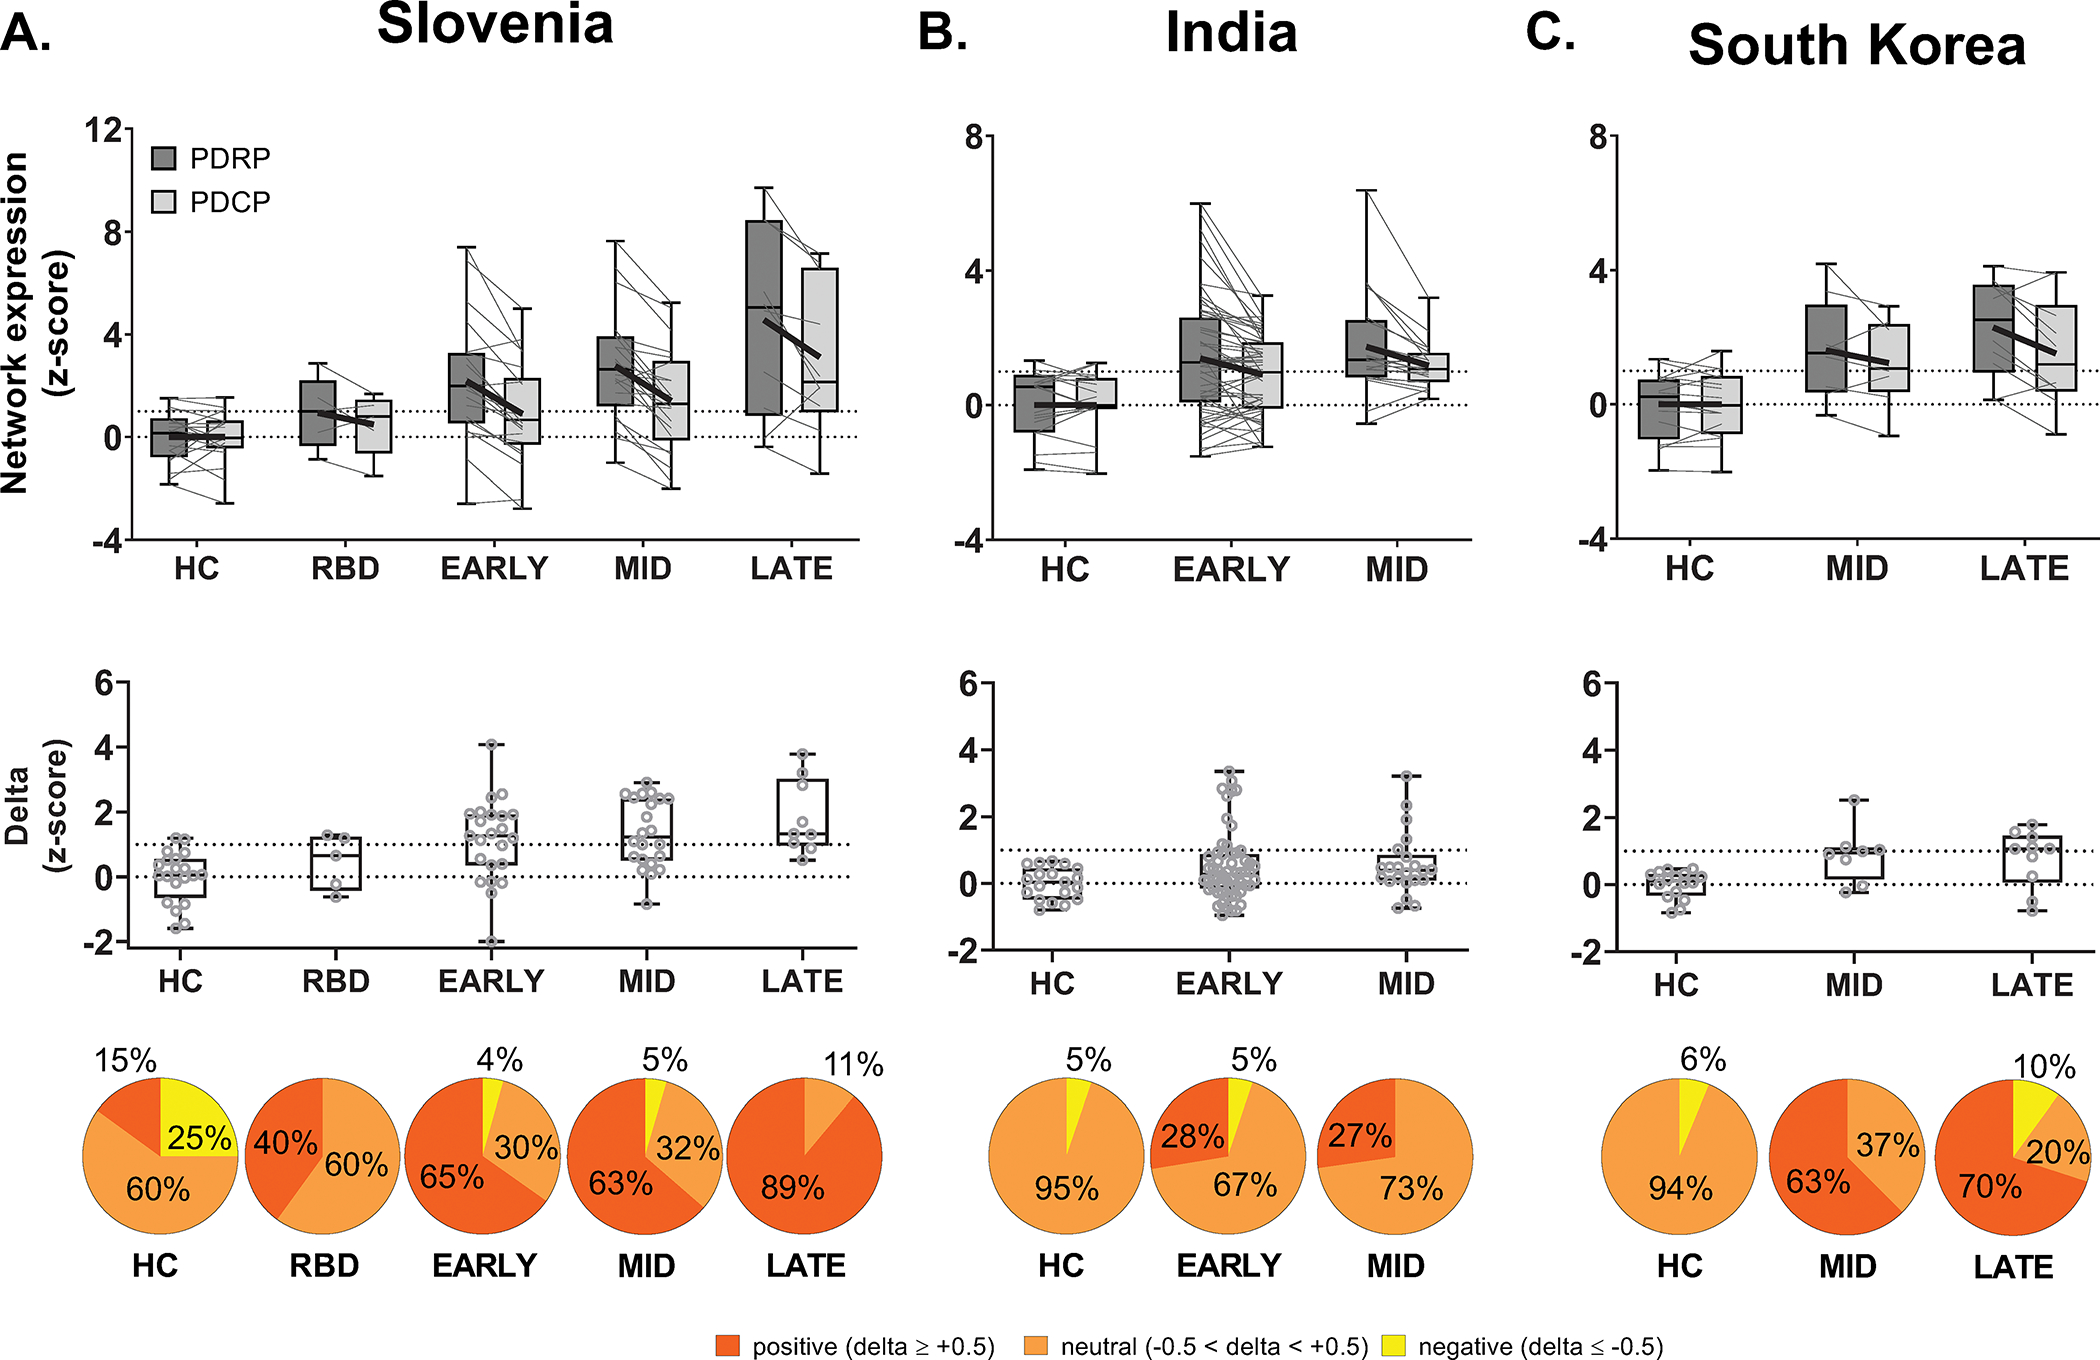
Figure 2. PDRP predominance in three independent Parkinson’s disease validation samples.

Bar graphs of PDRP and PDCP expression (top) and delta (middle) (mean ± SE) measured in idiopathic Parkinson’s disease (iPD) and healthy control (HC) validation samples from (A) Slovenia, (B) India, and (C) South Korea (see Table S1). For each sample, the gray lines in the box plots (top) connect PDRP and PDCP values measured in each of the subjects. Bold black lines connect mean PDRP and PDCP values for each group. As in Feinstein A, mean delta was positive in the validation samples, denoting greater expression in PDRP relative to PDCP in iPD, with increasing values in patients with longer symptom duration. Also as in Feinstein A, iRBD subjects in the Slovenia sample had delta that was between mean values for HC and early iPD. Bottom: The distribution of delta also differed across the patients in different disease stage (Slovenia: p<0.0005, India: p=0.047, South Korea: p<0.005; Jonckheere-Terpstra tests of trends; see text).
