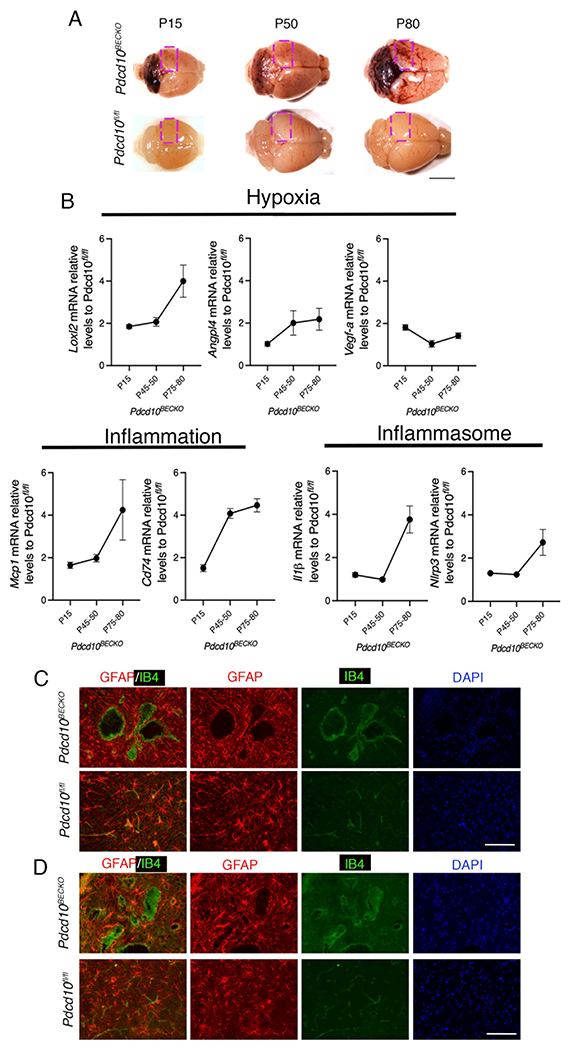
Figure 1. Increase of hypoxia and neuroinflammation signaling pathways in CCM disease.

A, CCM lesions are present in the cerebellum and cerebrum of Pdcd10BECKO mice at acute (P15), progression (P50), and chronic stage (P80). A square shows the region used in B for RNA analysis. Scale bar, 5 mm. B, Analysis of Loxl2, Angpl4, Vegfa, Mcp1, Cd74, Il1β, and Nlrp3 mRNA levels by RT-qPCR at acute, progression, and chronic stage as indicated. Data are mean ±SEM, Pdcd10BECKO mice, n=3; Pdcd10fl/fl mice, n=6. C, Immunofluorescence staining of GFAP+ astrocytes (red), and endothelial marker isolectin B4 (IB4; green) of cerebral sections from P15 Pdcd10BECKO and littermate control Pdcd10flfl. DAPI staining (blue) was used to reveal nuclei. n = 4 mice in each group. Scale bar, 100 μm. D, Immunofluorescence staining of GFAP+ astrocytes (red), and endothelial marker isolectin B4 (IB4; green) of cerebral sections from P80 Pdcd10BECKO and littermate control Pdcd10flfl. DAPI staining (blue) was used to reveal nuclei. n = 5 mice in each group. Scale bar, 100 μm.
