
Figure 1. 5HT1A and 5HT2A protein expression in whole homogenate from the hippocampus and temporal cortex by PGES duration.
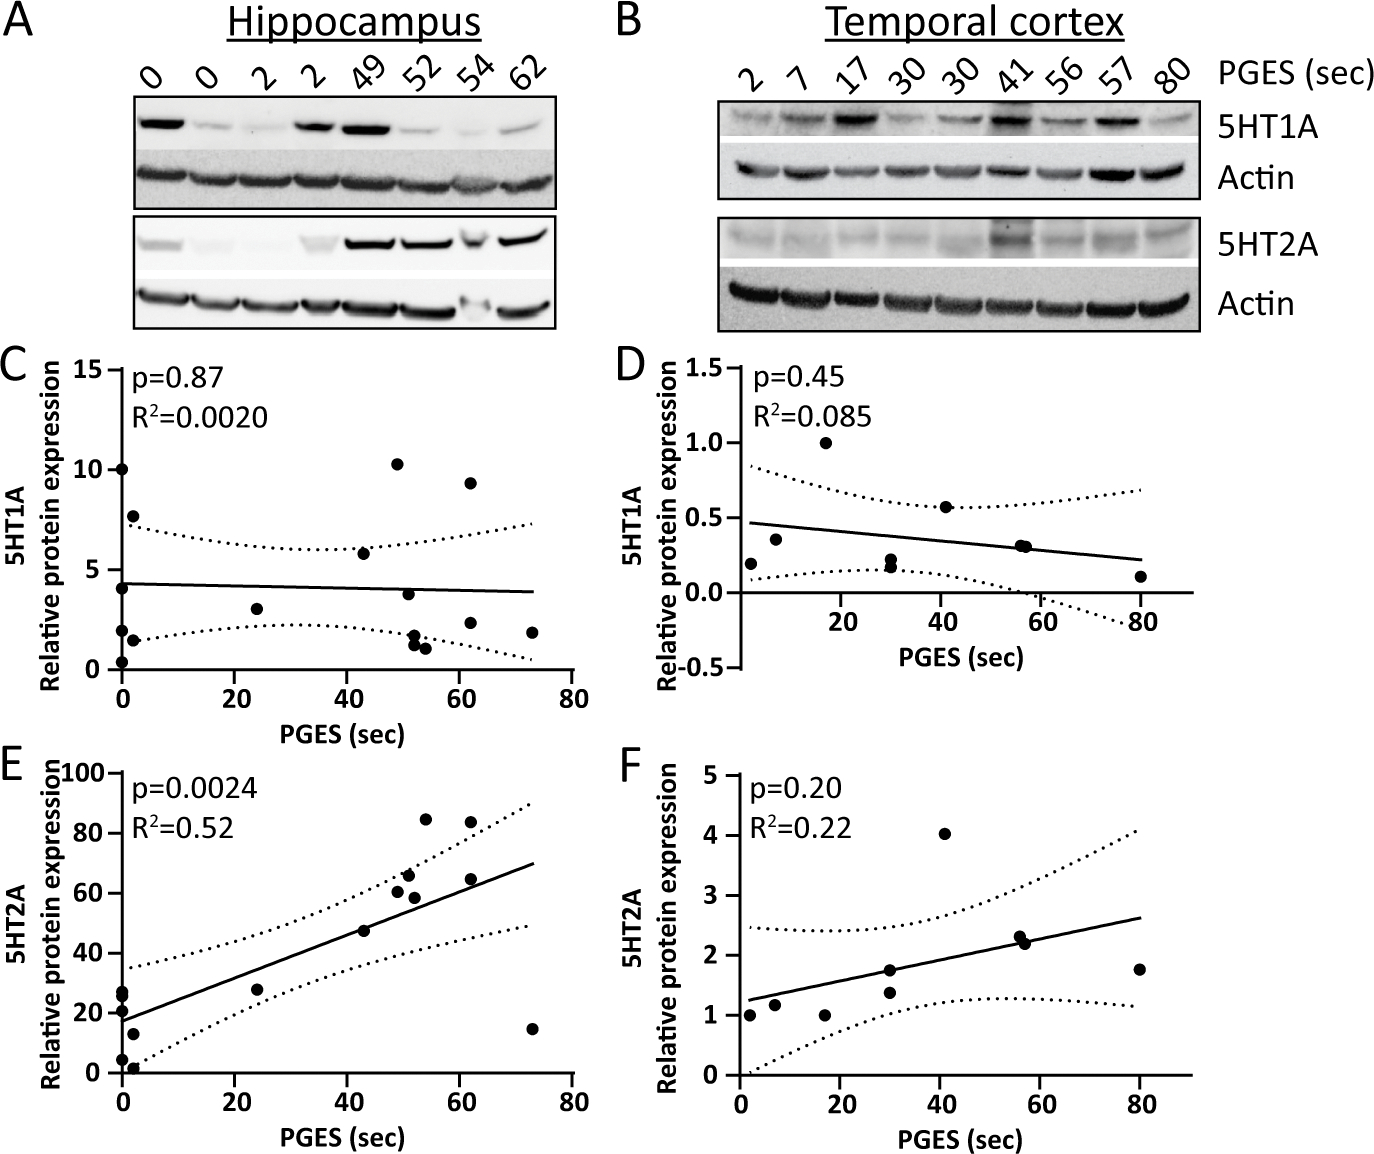
A) Representative western blot in hippocampus of 5HT1A (55 kDa), 5HT2A (55 kDa), and actin. B) Representative western blot in temporal cortex of 5HT1A (55 kDa), 5HT2A (55 kDa), and actin. C) Quantification of 5HT1A relative to actin in hippocampus (n = 16) indicates no correlation to PGES duration. D) Quantification of 5HT1A relative to actin in temporal cortex (n = 9) indicates no correlation to PGES duration. E) Quantification of 5HT2A relative to actin in hippocampus (n = 16) indicates a positive correlation to PGES duration. F) Quantification of 5HT2A relative to actin in temporal cortex (n = 9) indicates no correlation to PGES duration.