
Figure 2. 5HT1A protein expression in subregions of the hippocampus and temporal cortex by PGES duration.
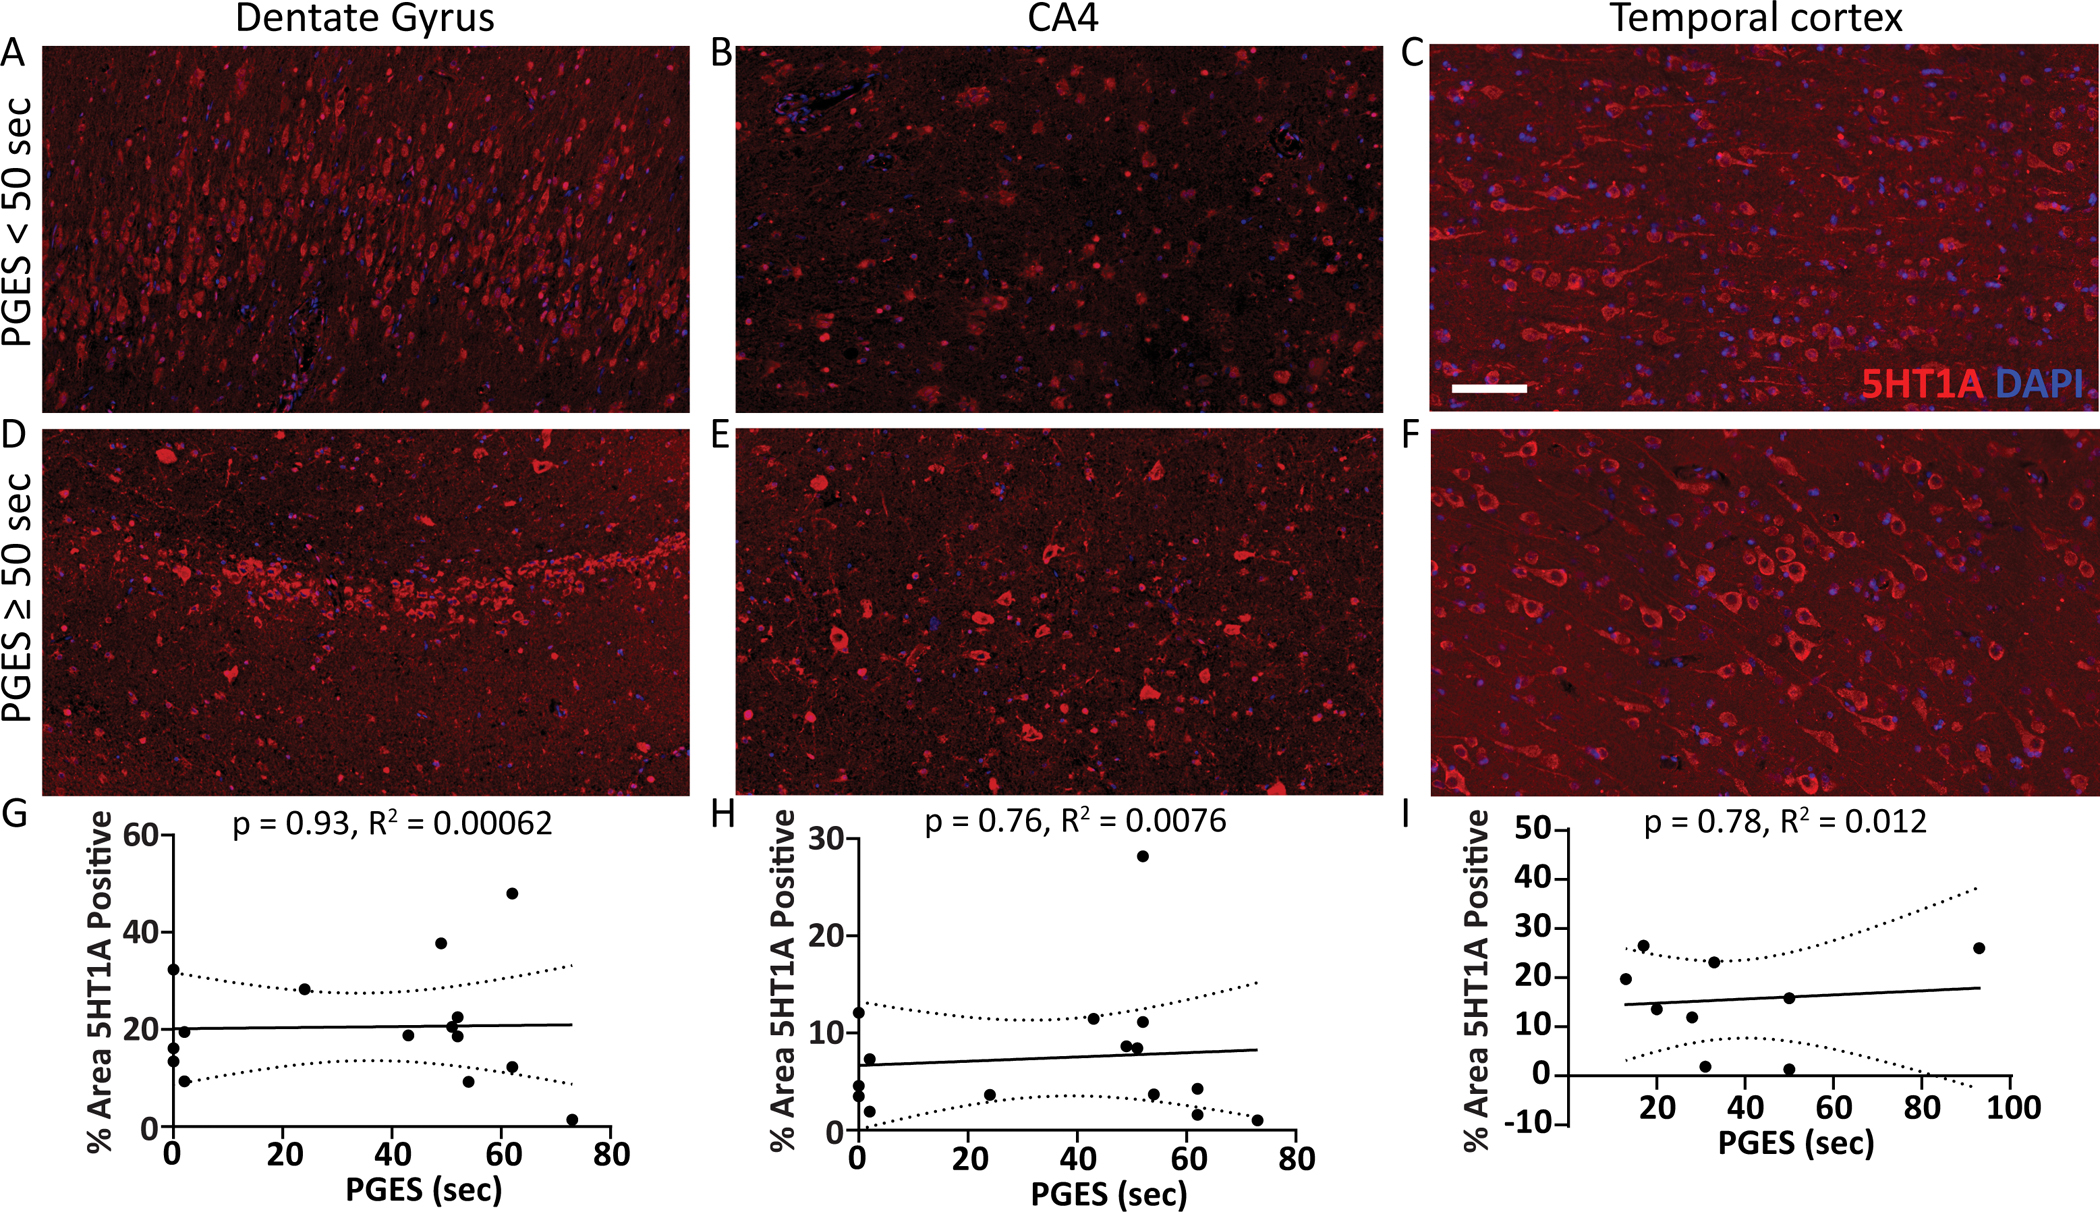
Representative images show 5HT1A expression (red) in surgical brain tissue from epilepsy cases in the hippocampal dentate gyrus, CA4 subsector, and temporal cortex A-C) with PGES < 50 seconds and D-F) PGES ≥ 50 seconds. G-I) Semiquantification of 5HT1A expression in subregions across the PGES duration spectrum indicates no correlation in the hippocampus (n = 16) or temporal cortex (n =9). Scale bar represents 100 μm for all histology panels.