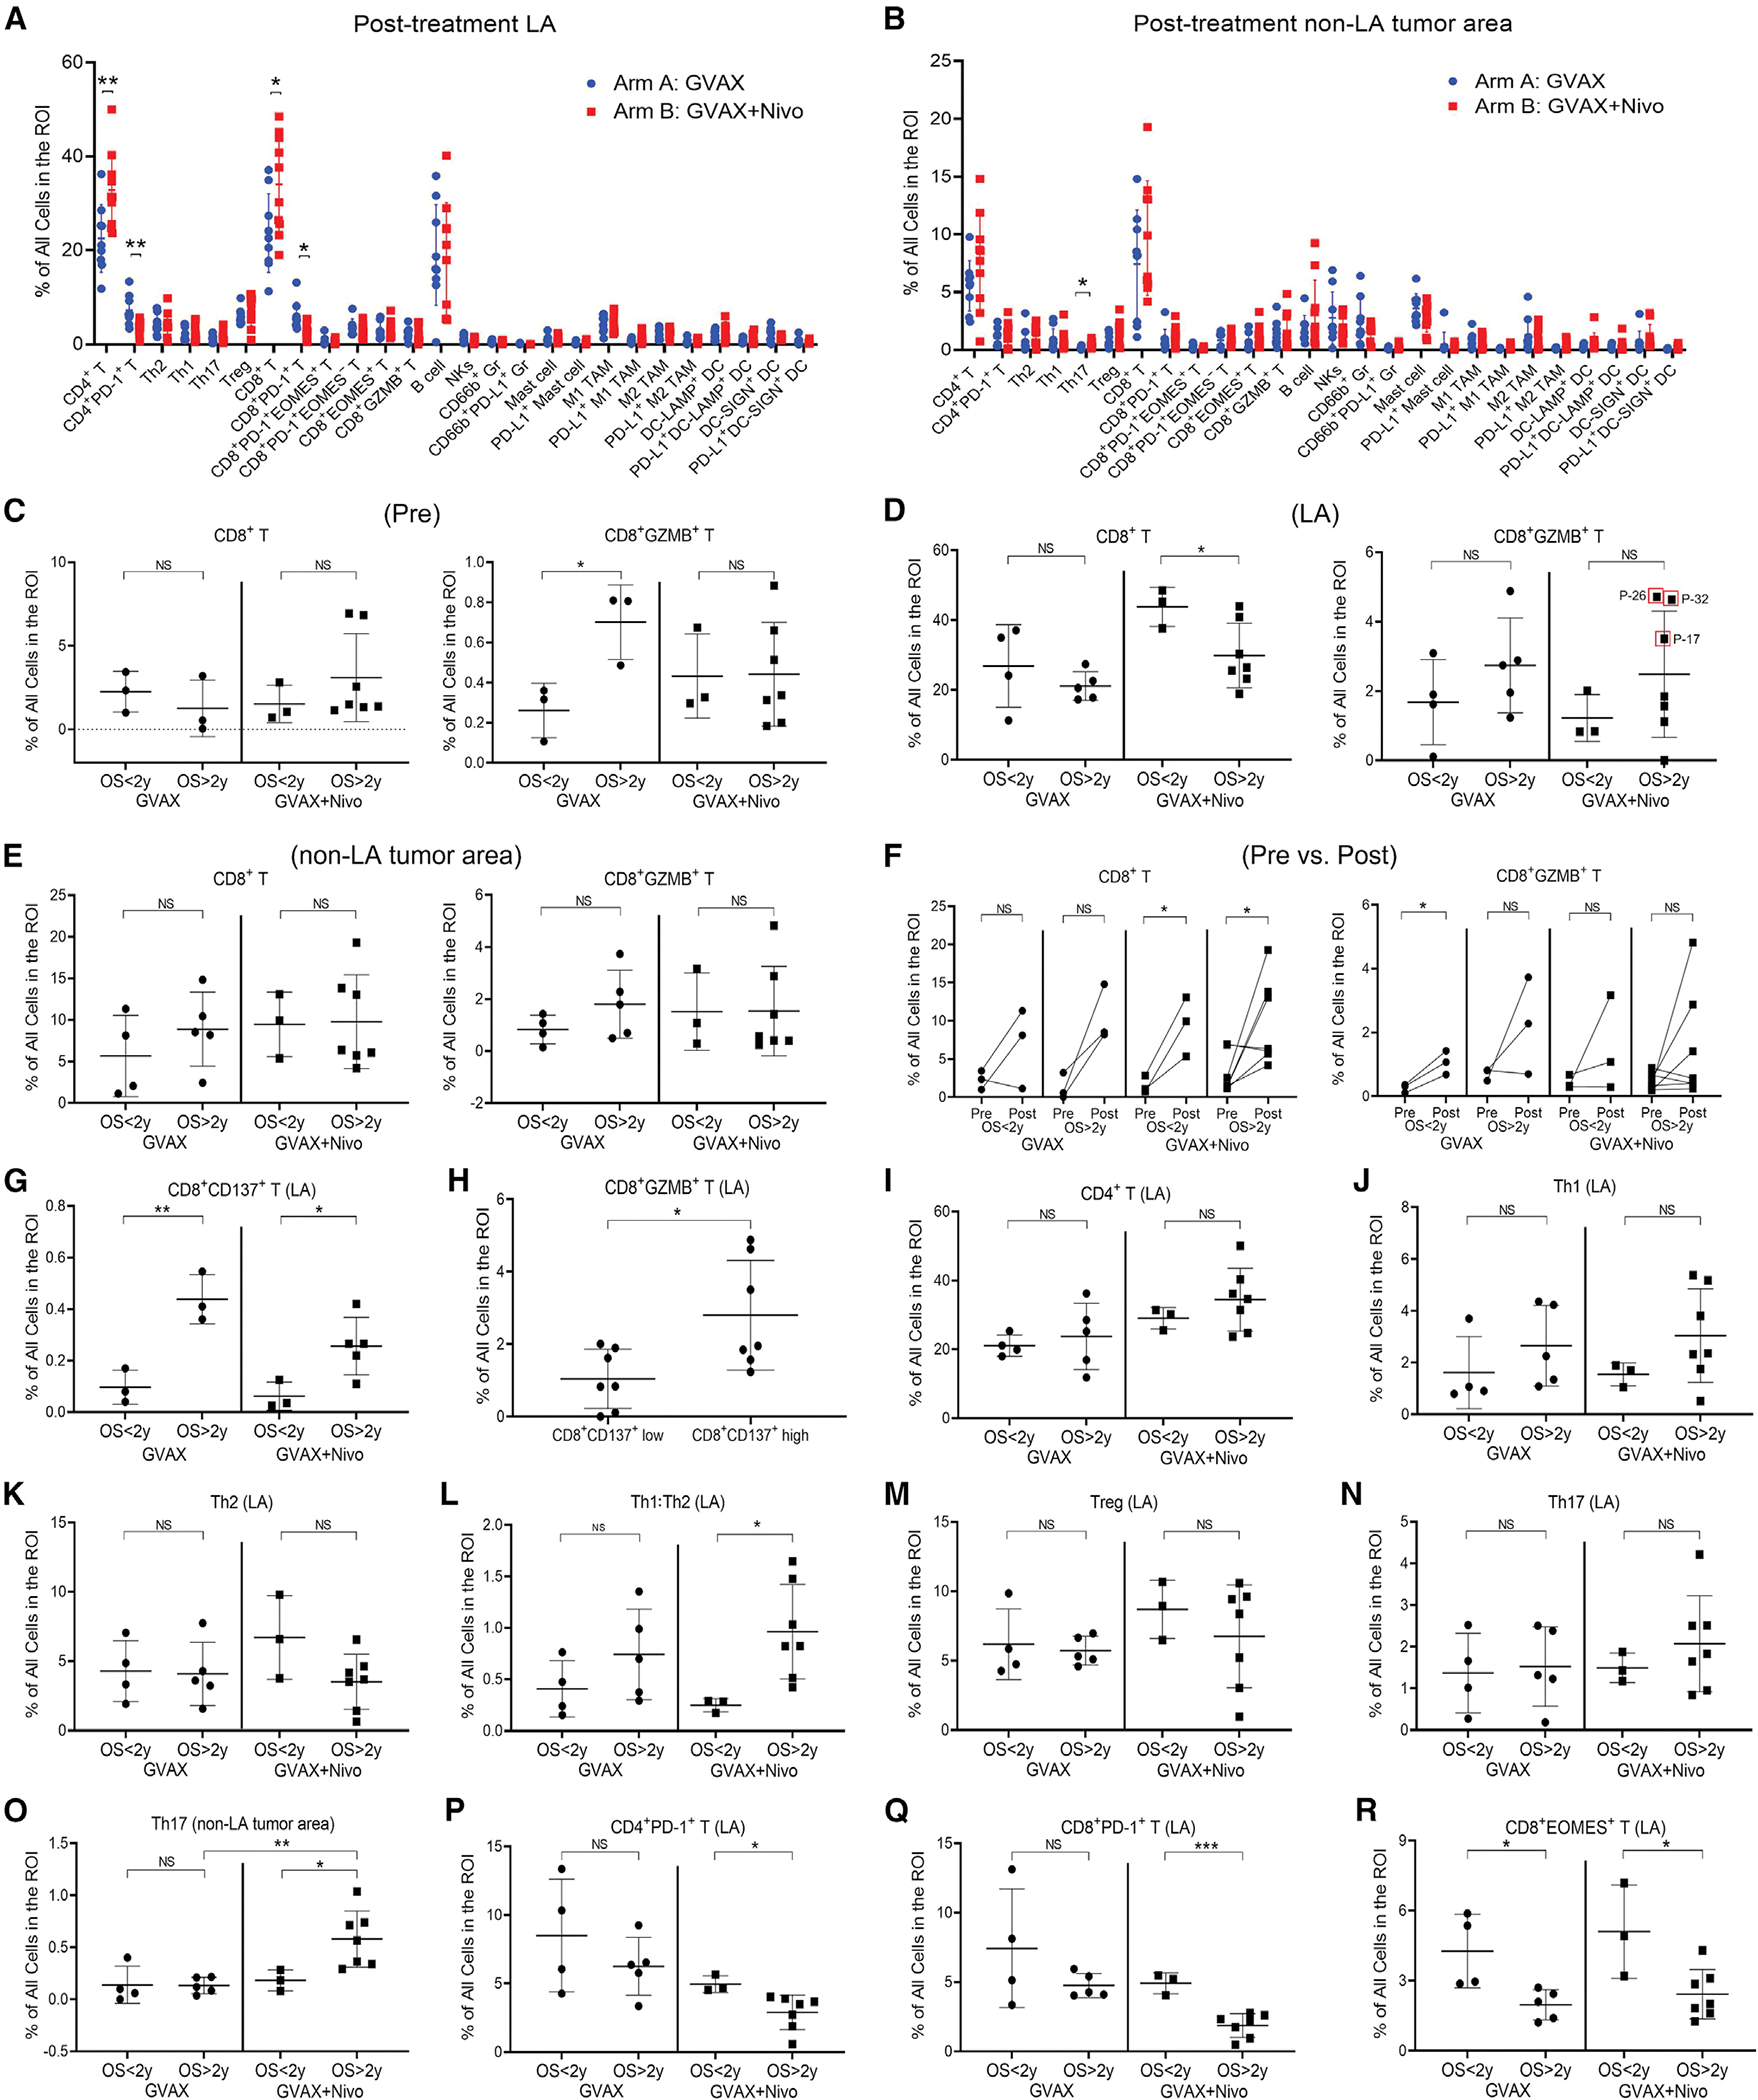
Figure 2. Multiplex IHC of CD8+ or CD4+ T subtypes and their correlation with OS.

(A and B) Summary of the density of all immune cell subtypes analyzed as indicated in LA (A) and non-LA tumor areas (B) in arm A (n =9) versus arm B (n=10) patients.
(C–E) Correlation between OS and CD8+ and CD8+GZMB+ T cells in pre-treatment tumor biopsies (C, pre, n = 6 for GVAX and n = 10 for GVAX + Nivo) and in LA (D) and non-LA tumor areas (E) from post-treatment tumors (see sample numbers in A and B). Three cases with the highest densities of CD8+GZMB+ T cells and the longest OS are circled.
(F) Changes in the density of CD8+ or CD8+GZMB+ T cells between pre-treatment (pre) and matched post-treatment non-LA tumor areas (post) and their correlation with OS.
(G) Correlation between OS and CD8+CD137+ T cells in LA.
(H) Correlation between CD8+GZMB+ T cells and CD8+CD137+ T cells in LA. Tumors are subgrouped by higher versus lower density of CD8+CD137+ T cells in LA.
(I–R) Correlation between OS and CD4+ T cells (I), Th1 (J), Th2 (K), Th1:Th2 ratio (L), Treg (M), and Th17 (N) in LA, Th17 in non-LA tumor area (O), and CD4+PD-1+ T cells (P), CD8+PD-1+ T cells (Q), and CD8+EOMES+ T cells (R) in LA. All data shown as the mean ± SD; all comparisons by t test; *p < 0.05; **p < 0.01; ***p < 0.001; NS, not significant; all others, not significant. See also Figures S3 and S4.
