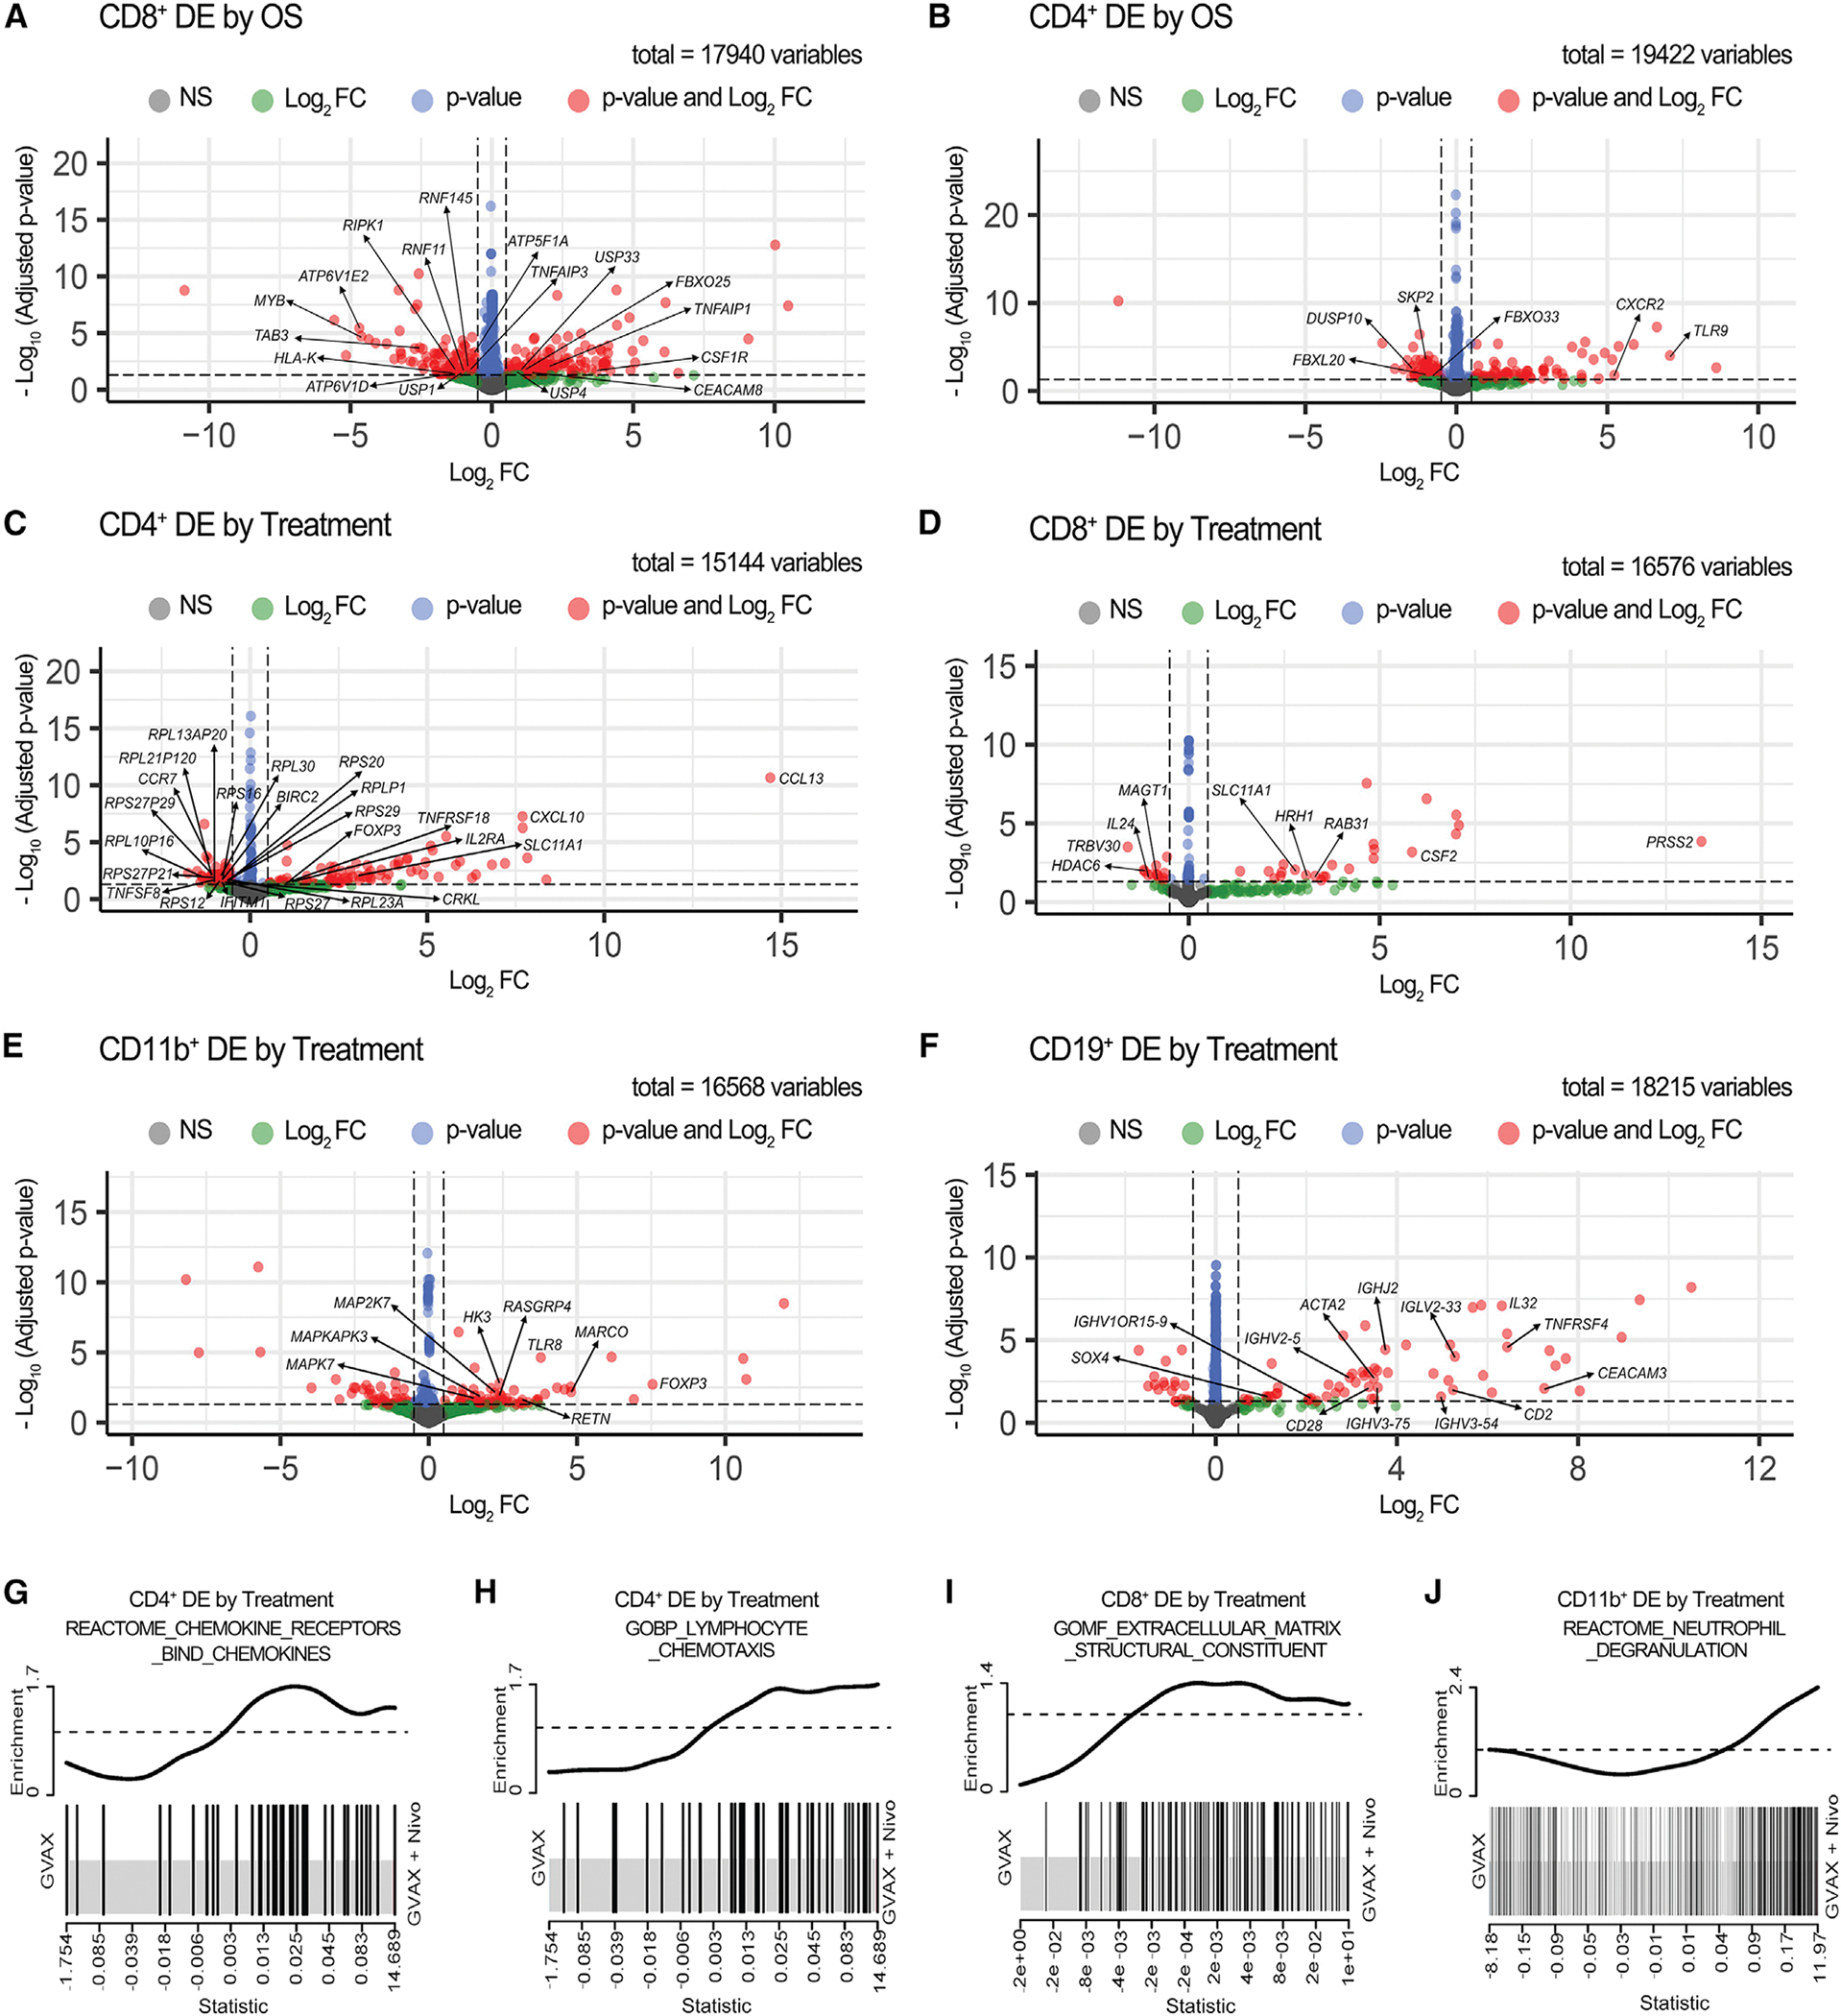
Figure 6. RNA-seq analysis of differentially expressed genes between different subcohorts from this study cohort of PDACs.

(A–B) Volcano plots showing differentially expressed (DE) genes compared between the OS > 2 years and OS < 2 years cohorts in sorted CD8+ (A) and CD4+ (B) T cells. (C-F) Volcano plots showing DE genes compared between treatment arms in sorted CD4+ T cells (C), CD8+ T cells (D), CD11b+ cells (E), and CD19+ B cells (F). The sample numbers are the same as in Figure 5. Vertical dashed lines indicate Log2 fold change (FC) at −0.5 and 0.5; horizontal dashed line indicates adjusted p value at 0.05. Genes that met either, both, or neither (NS) of the following two criteria: (1) Log2 FC > 0.5 or < −0.5 and (2) adjusted p value <0.05 are represented by color-coded dots. Total gene counts are indicated. Genes of interest are annotated.
(G–J) Enrichment plots showed upregulation of the REACTOM chemokine receptor bind chemokines pathway in sorted CD4+ T cells (G), the GOBP myeloid cells and lymphocyte chemotaxis pathway in sorted CD4+ T cells (H), the GOMF extracellular matrix structural constituent pathway in sorted CD8+ T cells (I), and the REACTOM neutrophil degranulation pathway in CD11b+ cells (J) in the GVAX + Nivo versus GVAX treatment arm. DE by treatment, differentially expressed between treatment arms. See also Tables S6 and S7.
