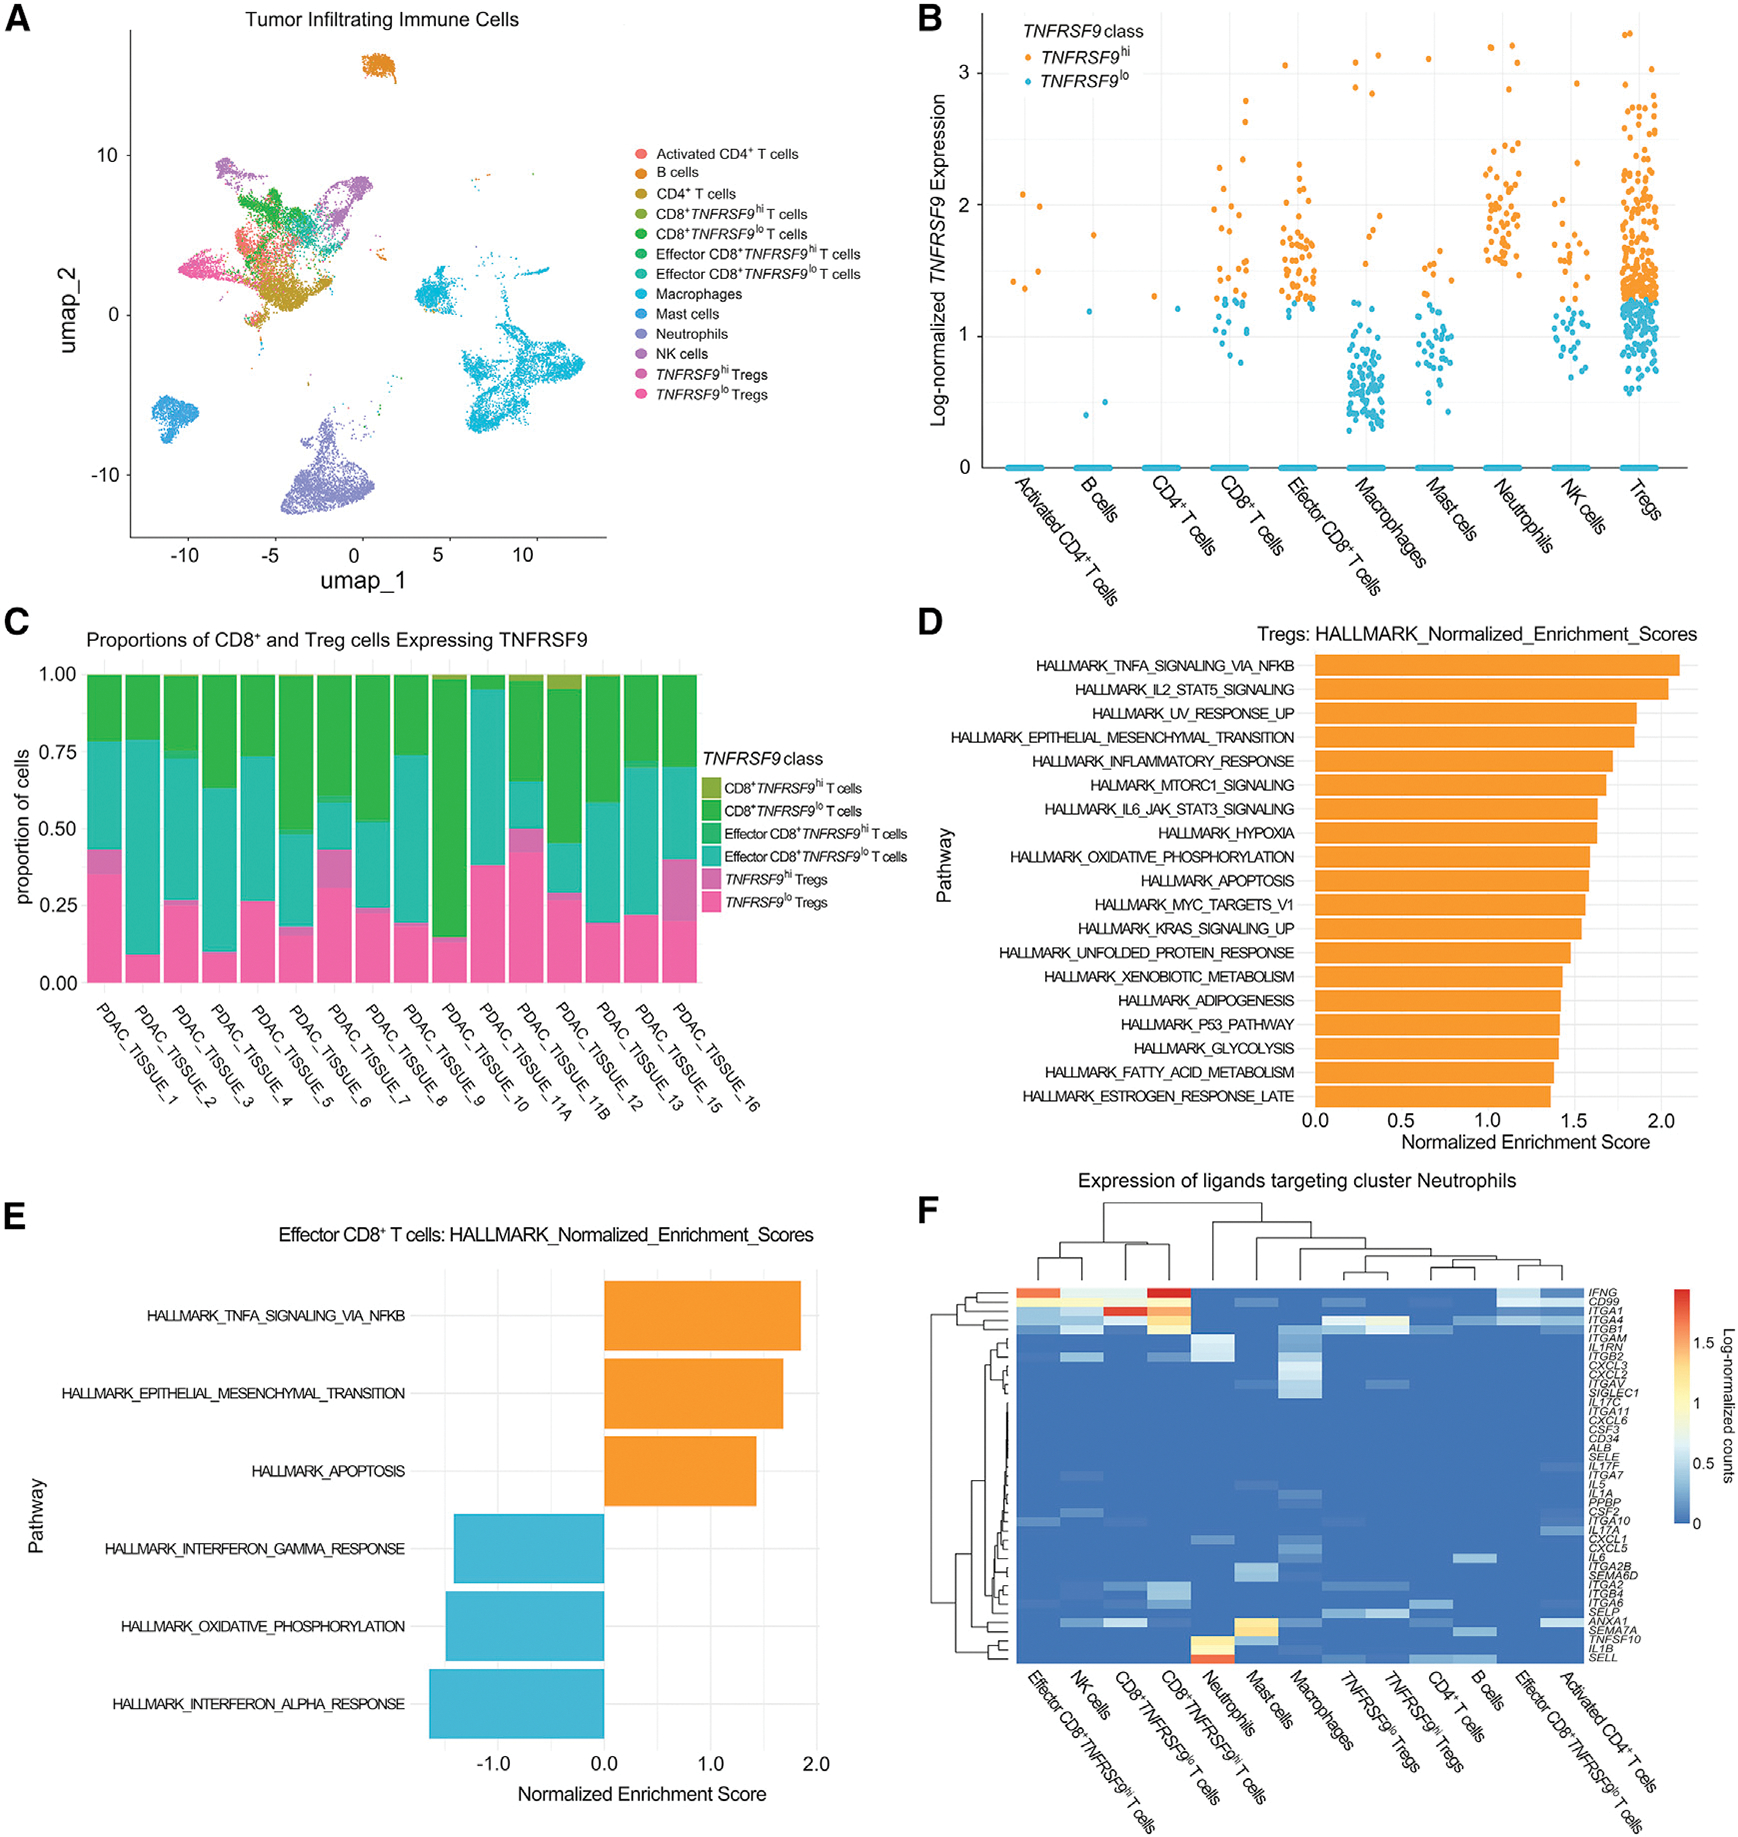
Figure 7. Single-cell analysis of CD137 (TNFRSF9)-expressing T cells.

(A) Uniform Manifold Approximation and Projection (UMAP) embedding of color-coded immune cell subtypes from the PDAC atlas.
(B) Immune cells from the PDAC atlas were annotated according to high (hi) or low (lo) TNFRSF9 expression and annotated for different immune cell subtypes.
(C) Stacked bar plots of the proportions of CD8+, effector CD8+, and Treg cells classified as TNFRSF9hi or TNFRSF9lo.
(D and E) MsigDB hallmark gene sets significantly enriched in TNFRSF9hi (orange) or TNFRSF9lo (blue) Tregs (D) and effector CD8+ cells (E) ordered by normalized enrichment score.
(F) Expression of ligands by immune cells that interact with receptors expressed by neutrophils is presented in the heatmap as scaled, log-normalized counts. See also Figure S9.
