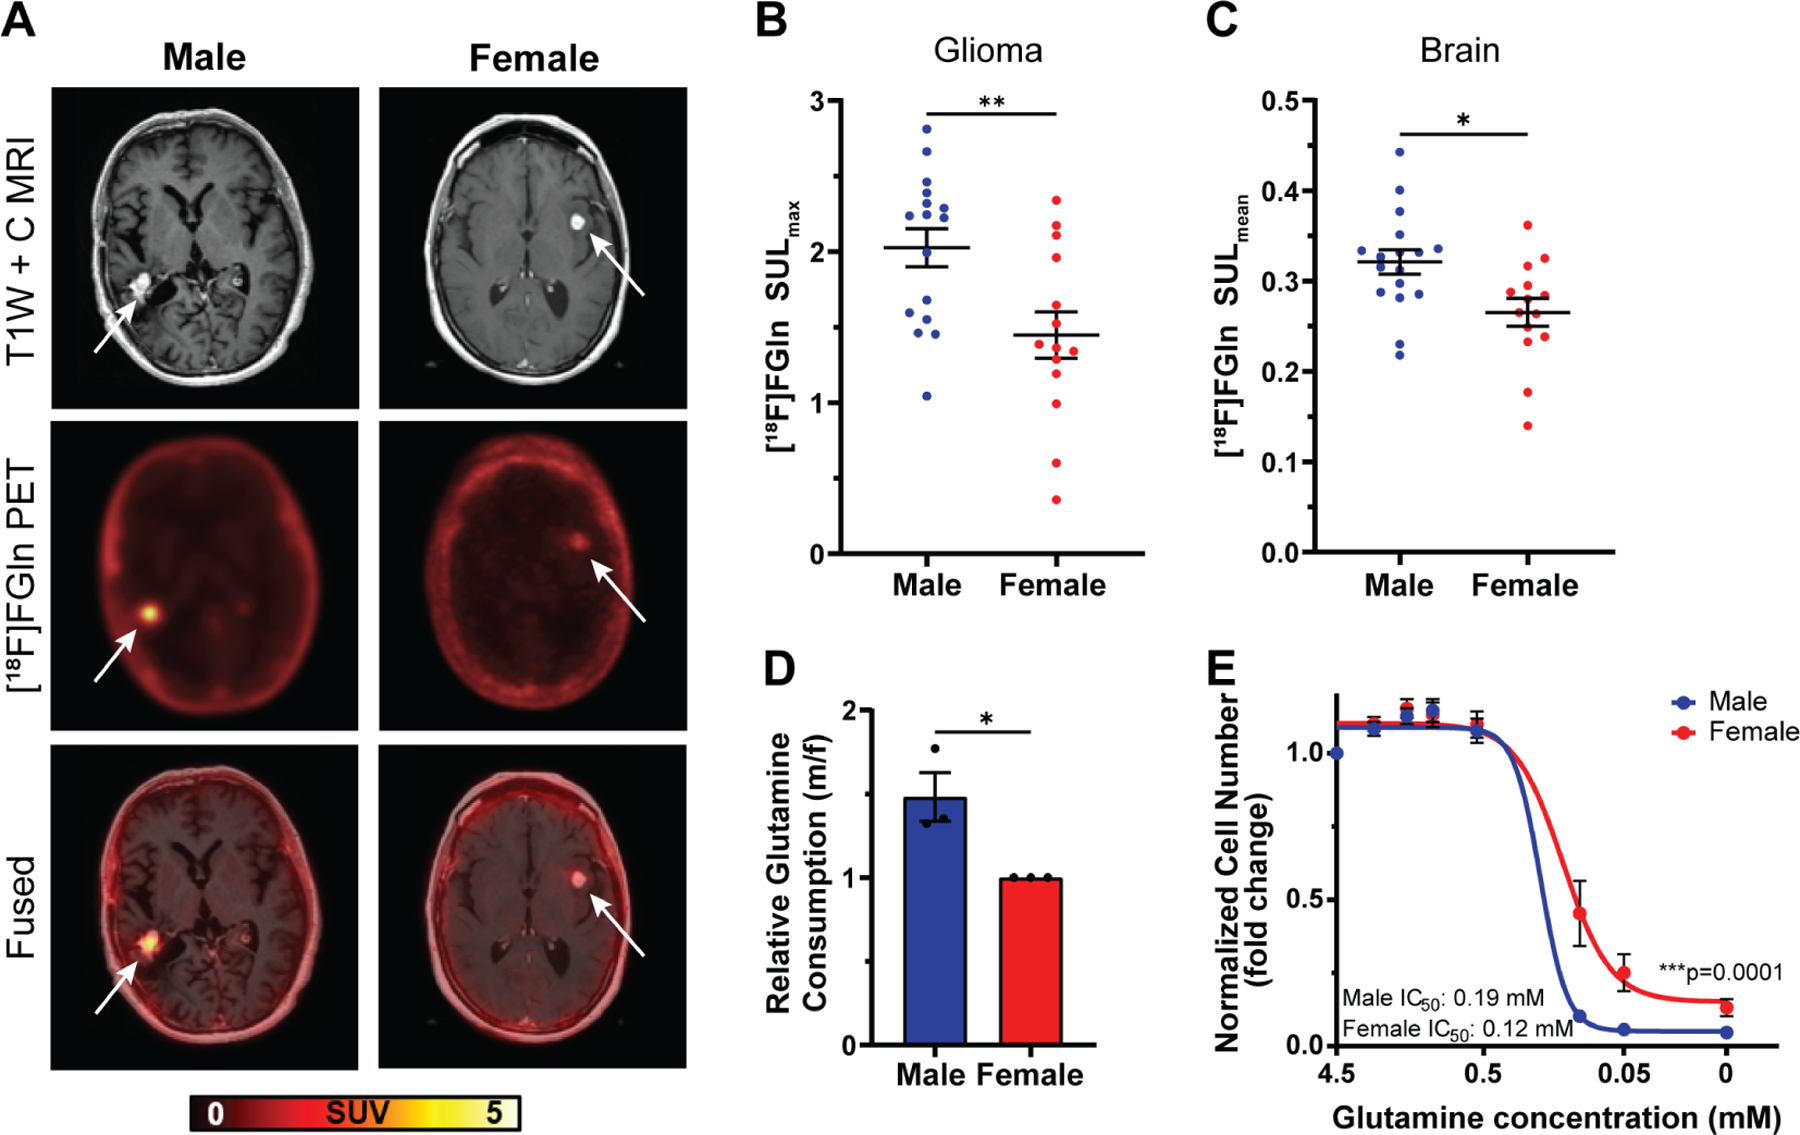
Figure 2. Males exhibit greater glutamine uptake in glioma and brain tissue.

A, Representative T1W contrast MRI image, [18F]fluoroglutamine ([18F]FGln) PET image, and fused image of a male and female high-grade IDH wild-type glioma patient. Representative images were chosen based on tumor location, MRI contrast enhancement, and tumor size. Tumor location is indicated by a white arrow. B-C, Quantification of [18F]FGln uptake in human gliomas (B) and normal grey matter (C). D, Relative glutamine consumption in transformed astrocytes. E, Glutamine dose-response curves of transformed astrocytes. Data are mean +/− SEM (B-C) of n=15 male and n=13 female patients. *p<0.05, **p<0.01, t-test. Data are mean +/− SEM of n=3/sex (three independent experiments, one male and female cell line). *p<0.05; linear mixed effects model (D). Data are mean +/− SEM of n=9/sex (three independent experiments, three separate male and female cell lines). ***p=0.0001; two-way ANOVA (E). See also Figure S2 and Table S2.
