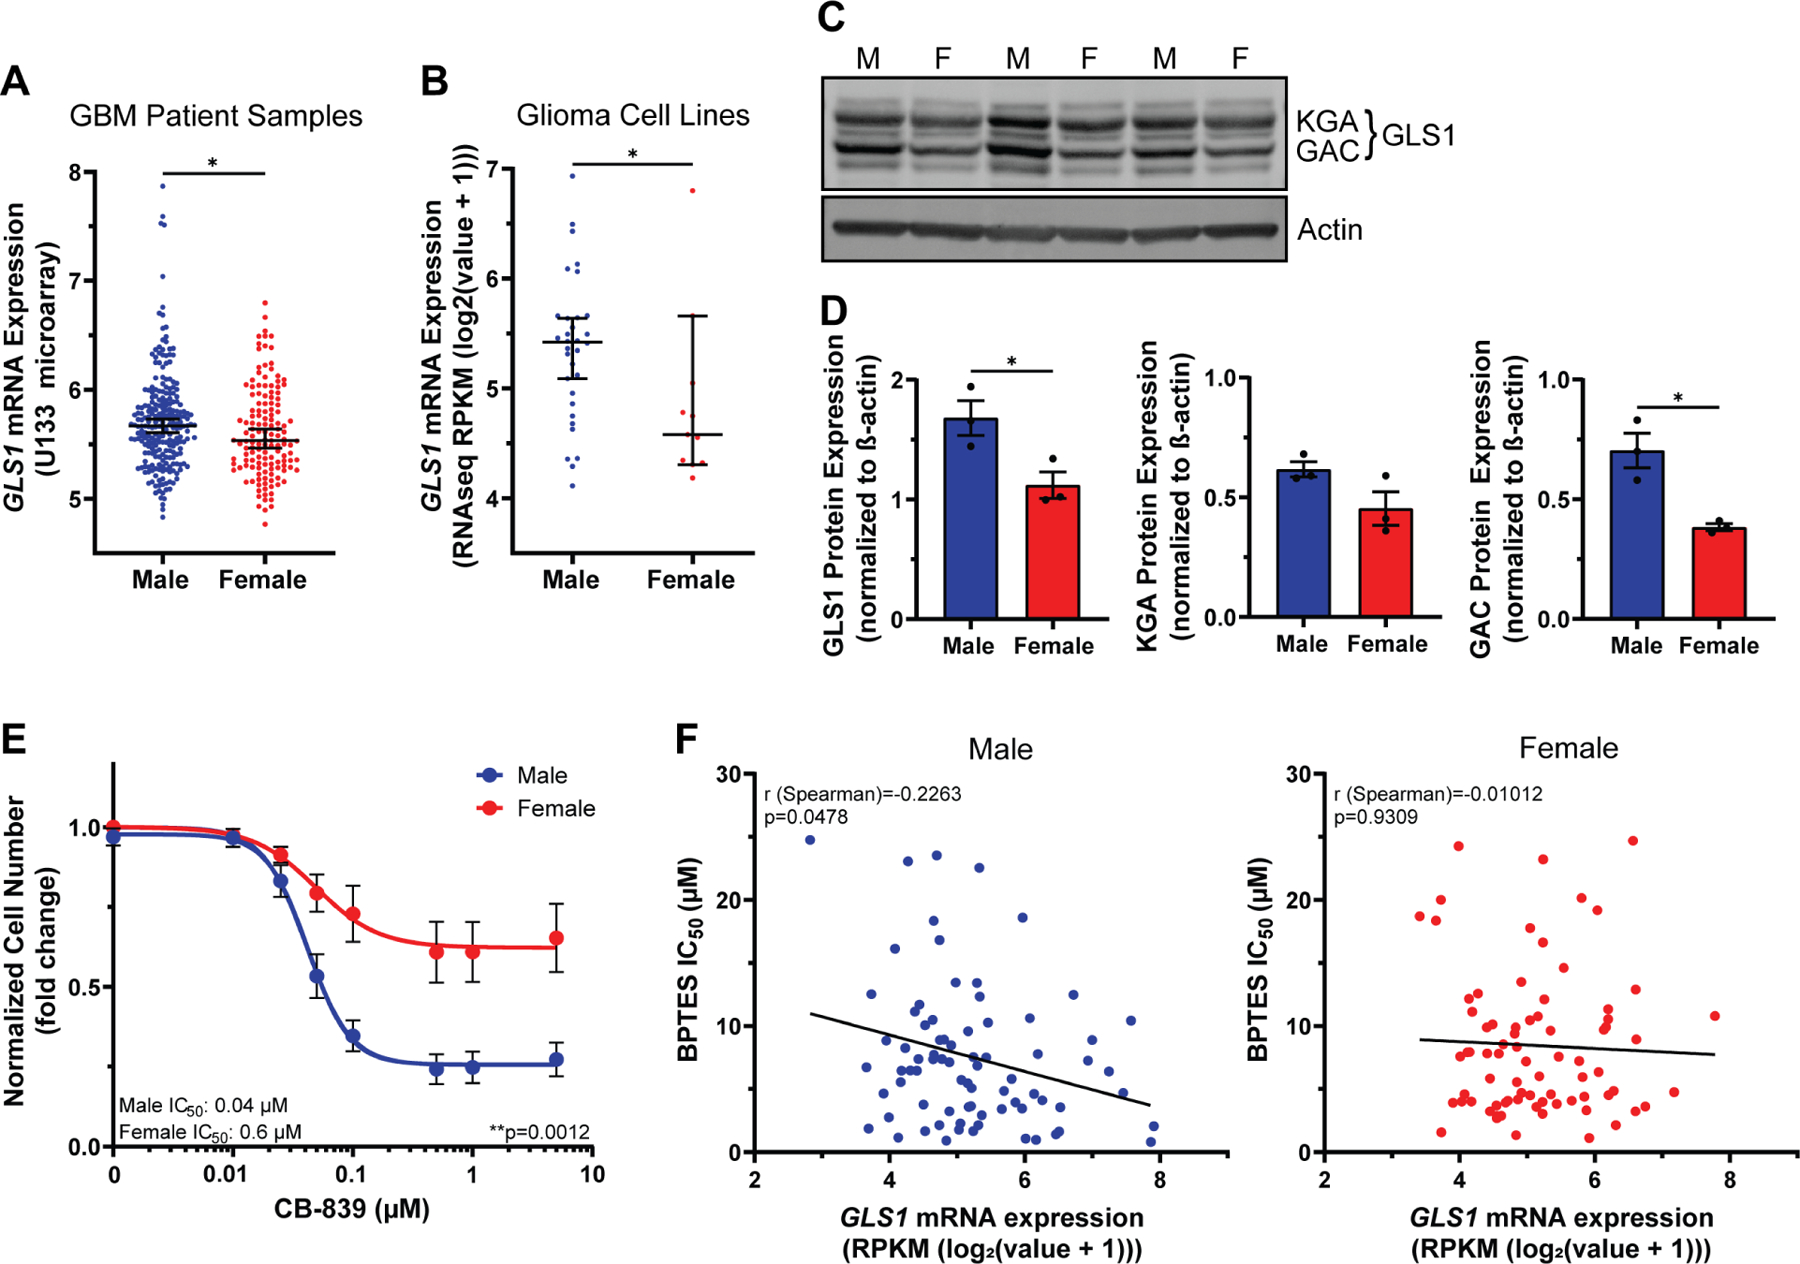
Figure 4. GLS1 expression and dependency are greater in male transformed astrocytes and gliomas.

A-B, GLS1 mRNA expression levels in n=232 male and n=139 female IDH wild-type GBM patient samples (A) and n=32 male and n=11 female human glioma cell lines (B). C, Western blot showing the two GLS1 isoforms (KGA and GAC) in transformed astrocytes from three independent experiments. The lanes to the left and the right of the samples contained protein ladder and were digitally cropped from the image. M=male, F=female. D, Western blot quantification of GLS1 and its isoforms KGA and GAC. Expression values are normalized to β-actin. E, CB-839 dose-response curves of transformed astrocytes. F, Nonparametric Spearman correlation between GLS1 mRNA expression levels and BPTES IC50 values in n=77 male (left) and n=76 female (right) tumor cell lines. Data are median +/− 95% CI. *p<0.05; Mann-Whitney test (A-B). Data are mean +/− SEM of n=3/sex (three independent experiments using one male and female cell line). *p<0.05; t-test (D). Data are mean +/− SEM of n=9/sex (three independent experiments, three separate male and female cell lines). **p=0.0012; two-way ANOVA (E). See also Figure S3 and Table S5.
