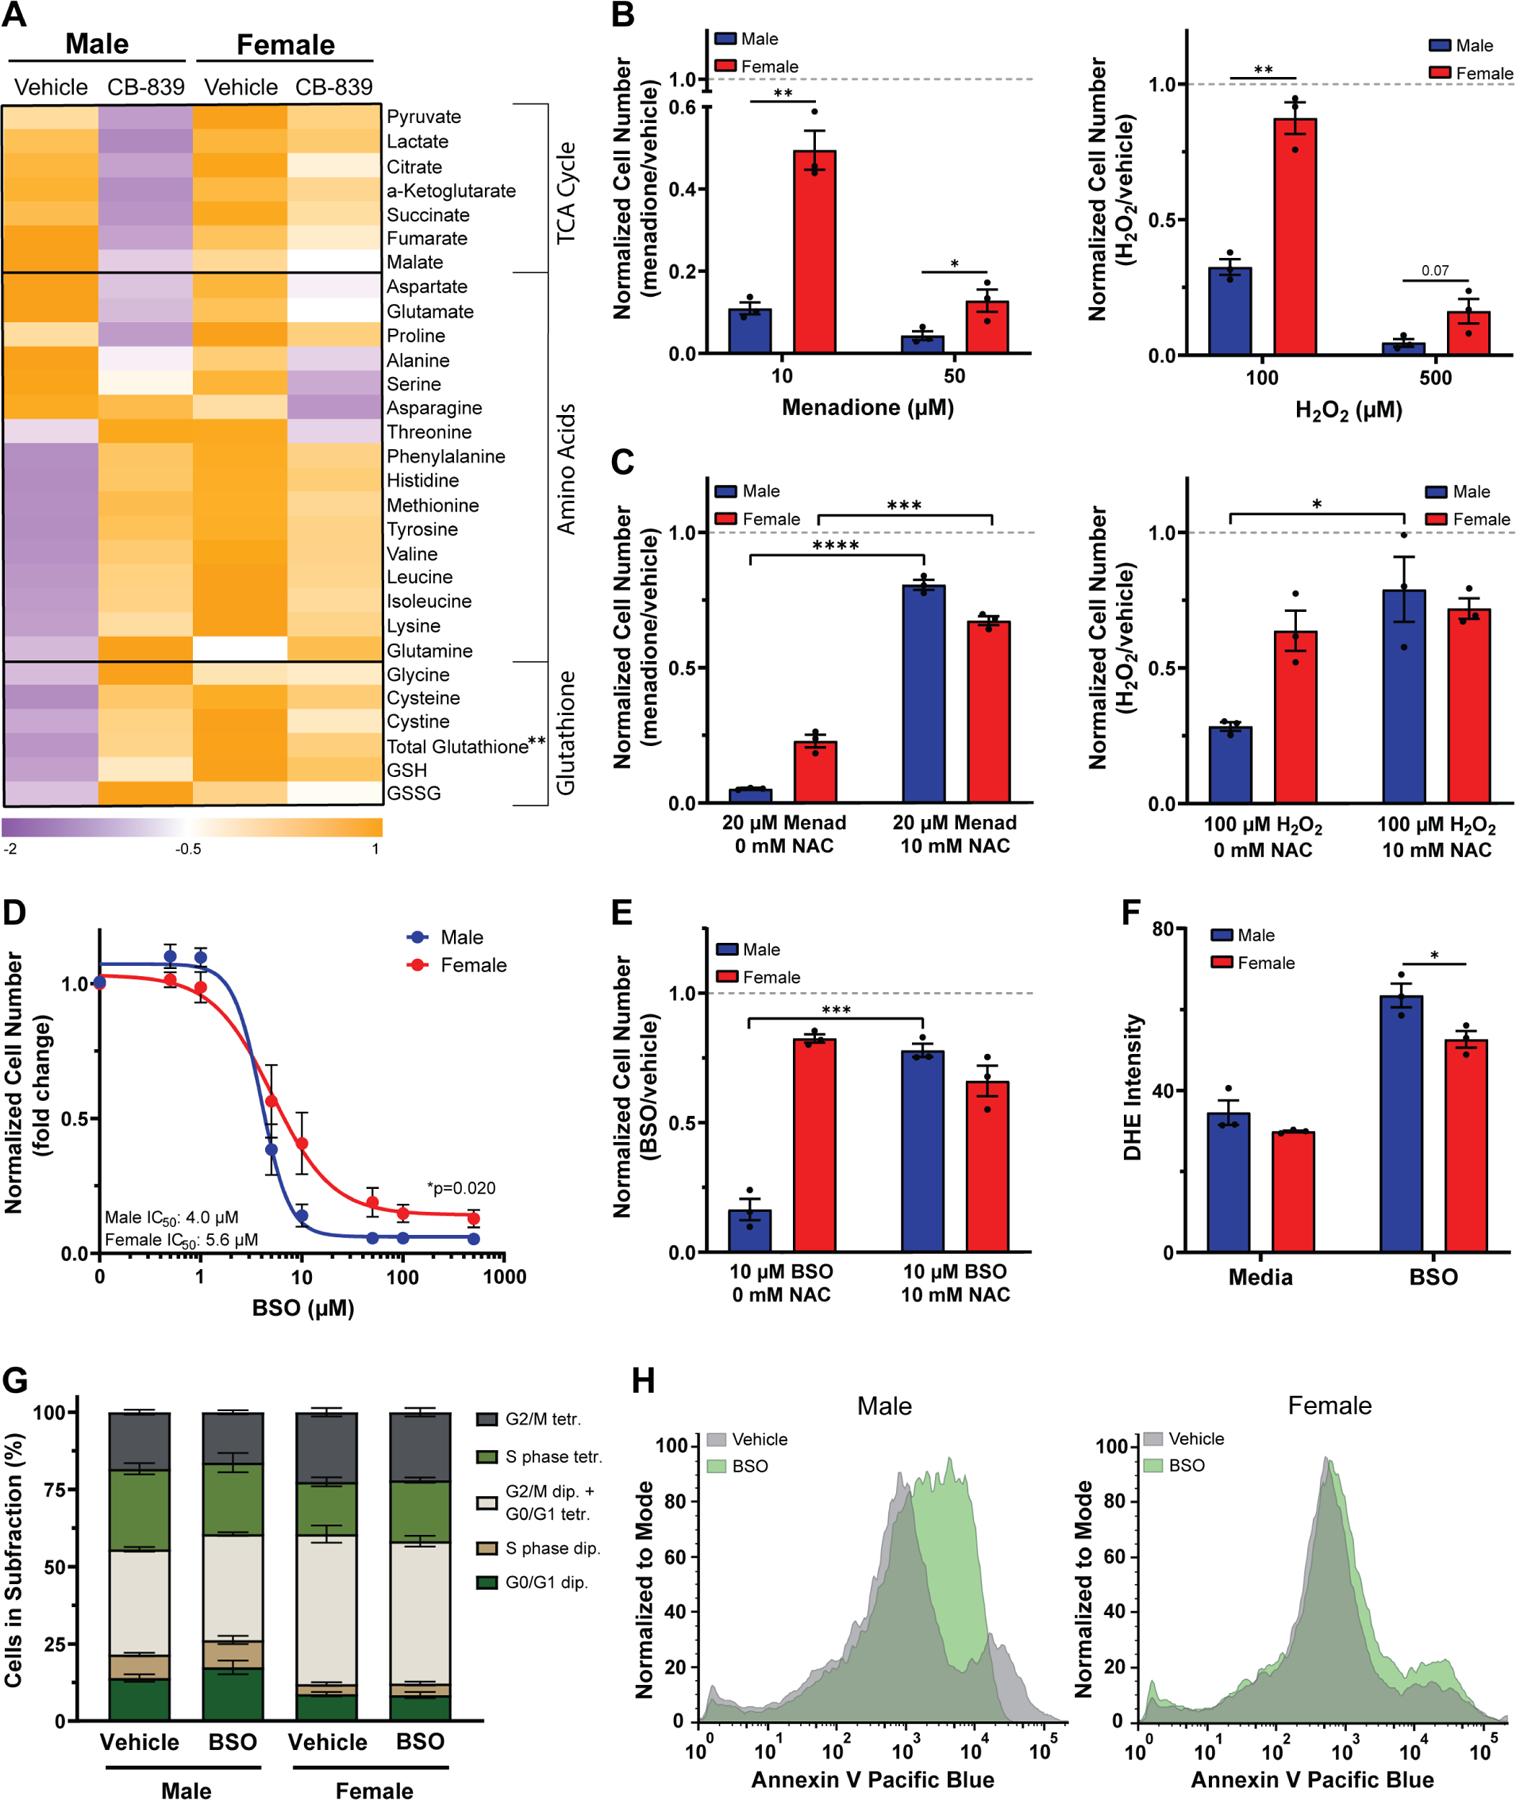
Figure 5. Male transformed astrocytes are more dependent on glutathione for redox balance.

A, Heatmap of metabolite levels in transformed astrocytes treated with CB-839 or vehicle for 24 hrs. TCA cycle and amino acid metabolite abundance were measured via GC/MS; glutathione levels were measured using a spectrophotometric recycling assay. B, Cell number assay of transformed astrocytes treated with menadione or vehicle (left) or H2O2 or vehicle (right). C, Cell number assay of transformed astrocytes treated with menadione or vehicle and N-acetyl cysteine (NAC) (left) or H2O2 or vehicle and NAC (right). D, Buthionine sulfoximine (BSO) dose-response curves of transformed astrocytes. E, Cell number assay of transformed astrocytes treated with BSO or vehicle and NAC. F, Quantification of dihydroethidium (DHE) fluorescence intensity per cell in transformed astrocytes treated with BSO or vehicle. G, Quantification of propidium iodide histograms (Fig. S4D) of transformed astrocytes treated with BSO or vehicle. H, Representative Annexin V histograms of transformed astrocytes treated with BSO or vehicle. Histograms shown are representative examples chosen from three independent. Data are mean +/− SEM of n=3/sex (three independent experiments, one male and female cell line), or for (D) mean +/− SEM of n=9/sex (three independent experiments, three separate male and female cell lines). **q<0.01; t-test, FDR adjusted p-values (A, G). *p<0.05, **p<0.01, ***p<0.001, ****p<0.0001; t-test (B-C, E-F). *p=0.020; two-way ANOVA (D). See also Figure S4.
