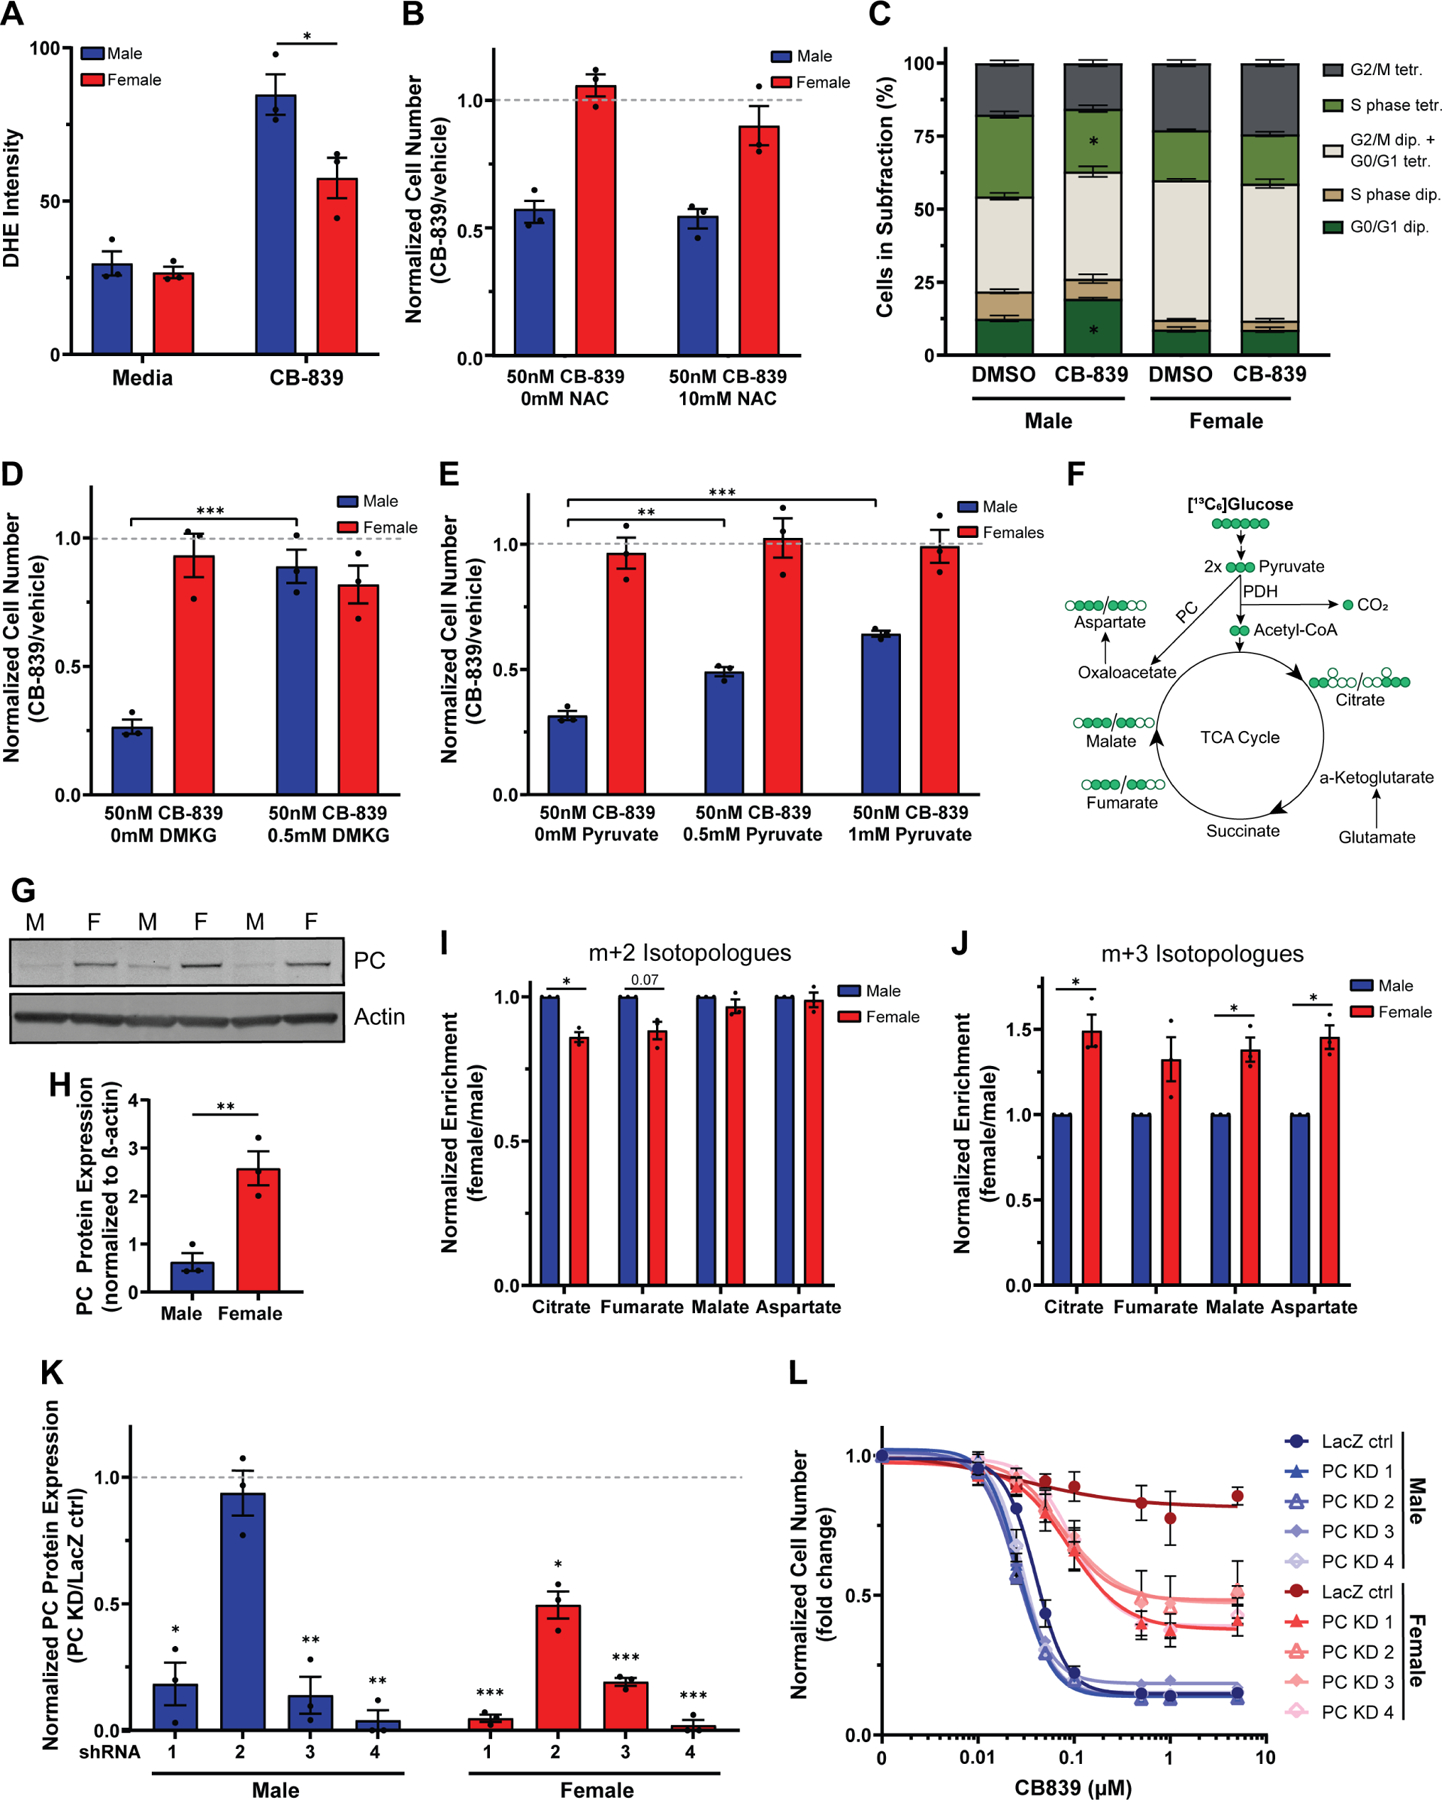
Figure 6. Male transformed astrocytes require glutamine to replenish their TCA cycle.

A, Quantification of dihydroethidium (DHE) fluorescence intensity per cell in transformed astrocytes treated with CB-839 or vehicle. B, Cell number assay of transformed astrocytes treated with CB-839 or vehicle and N-acetyl cysteine (NAC). C, Quantification of propidium iodide histograms (Fig. S5C) of transformed astrocytes treated with CB-839 or vehicle. D, Cell number assay of transformed astrocytes treated with CB-839 or vehicle and dimethyl-α-ketoglutarate (DMKG). E, Cell number assay of transformed astrocytes treated with CB-839 or vehicle and pyruvate. F, TCA cycle flux schematic. G, Western blot showing PC expression in transformed astrocytes under basal media conditions from three independent experiments. The lanes to the left and the right of the samples contained protein ladder and were digitally cropped from the image. M=male, F=female. H, Western blot quantification of PC. Expression values are normalized to β-actin. I-J, Label incorporation of [13C6]glucose in transformed astrocytes. Label incorporation into metabolites was measured via GC/MS. m+2 (I) and m+3 isotopologues (J) after one turn of the TCA cycle are shown. K, Western blot quantification of transformed astrocyte control cells (LacZ ctrl) and transformed astrocyte PC knockdown cells (PC KD). All expression values are normalized to β-actin. Protein levels in knockdown samples were normalized to their respective control. L, CB-839 dose-response curves of male and female transformed astrocyte control cells (LacZ ctrl) and transformed astrocyte PC knockdown cells (PC KD 1–4). IC50 values are not depicted since no IC50 value could be calculated for the female LacZ ctr. Data are mean +/− SEM of n=3/sex (three independent experiments, one male and female cell line). *p<0.05, **p<0.01, ***p<0.001; t-test (A, B, D, E, H, K). *q<0.05; t-test, FDR adjusted p-values (C). *q<0.05; linear mixed effects model, FDR adjusted p-values (I-J). Male LacZ ctrl compared to male PC KD cell lines: PC KD 1: p=0.09, PC KD 2: p=0.03, PC KD 3: p=0.71, PC KD 4: p=0.40. Female LacZ ctrl compared to female PC KD cell lines: PC KD 1–4: p<0.001; two-way ANOVA, Dunnetťs multiple comparisons test (L). See also Figure S5 and Tables S3, S6, and S7.
