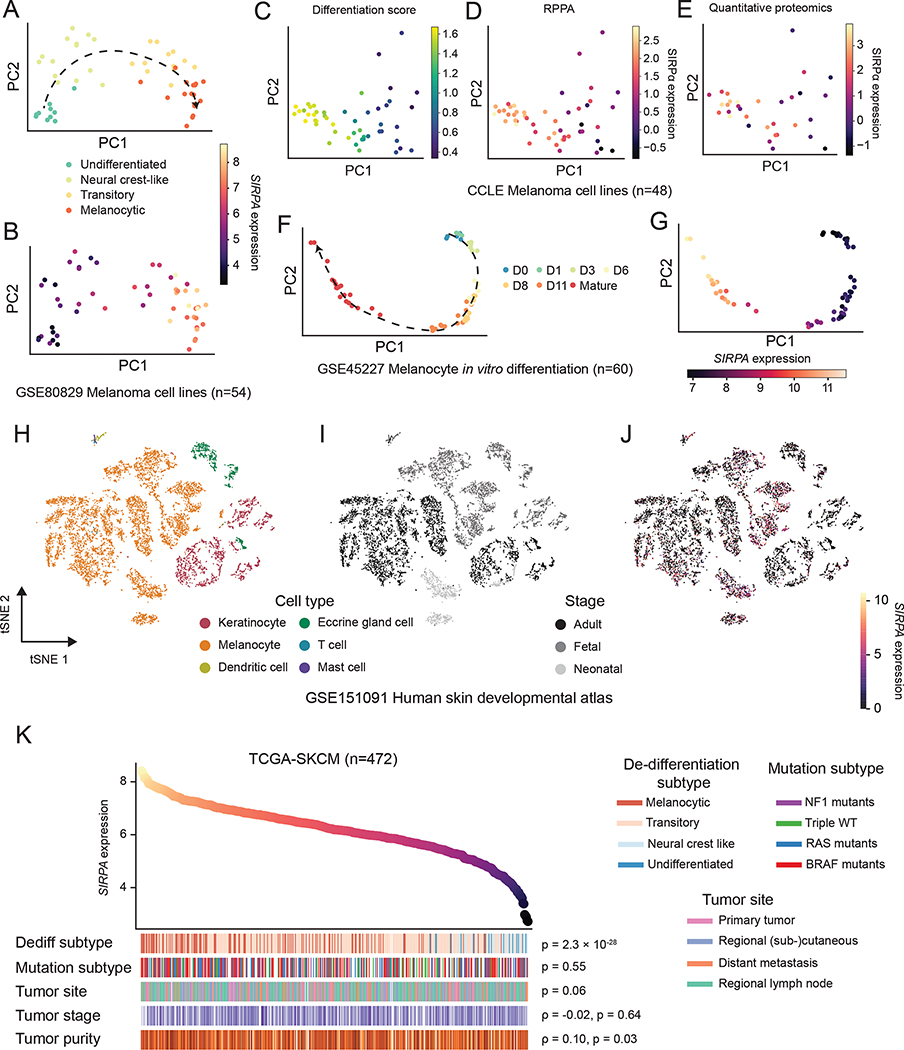
Figure 3. SIRPA expression dynamics in melanocyte maturation and melanoma de-differentiation.
(A, B) PCA projection of human melanoma cell lines from Tsoi et al., based on gene expression profiles and colored by de-differentiation stages (A) or normalized SIRPA expression level (B). (C-E) PCA projection of human melanoma cell lines from CCLE, based on gene expression profiles and colored by differentiation score (C), SIRPα protein by RPPA (D), or SIRPα protein expression by quantitative proteomics (E). (F, G) PCA projection of in vitro differentiating human melanocytes from Mica et al., based on gene expression profiles and colored by differentiation time (F) or normalized SIRPA expression level (G). (H-J) Two-dimensional t-SNE projection of human skin single cells from Belote et al., colored by cell type (H), developmental stage (I), and normalized SIRPA expression level (J). The color key indicates the normalized SIRPA expression (A, B, F, G, J), differentiation score (C), SIRPα protein expression by RPPA (D), or SIRPα protein expression by quantitative proteomics (E). (K) Top panel, a scatterplot of TCGA melanoma (TCGA-SKCM) samples ranked by SIRPA expression level. Bottom panel, heatmap showing biological and clinical features of ordered TCGA-SKCM samples. The Kruskal-Wallis test was used to compute P values for the association of SIRPA expression with de-differentiation stages, mutational subtypes, and tumor sites. The Spearman’s rank correlation was used to evaluate the association of SIRPA expression with tumor stage and tumor purity. See also Figure S3.

