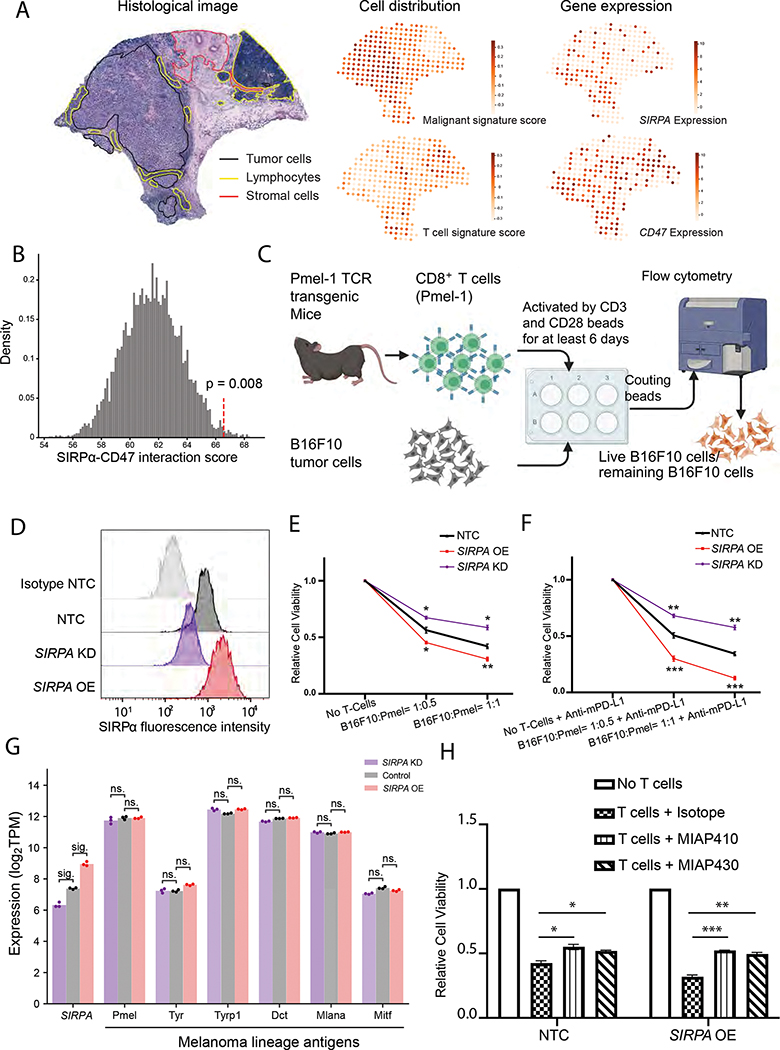
Figure 4. Effect of SIRPα inhibition on T-cell-mediated antitumor response in melanoma cells.
(A) Hematoxylin and eosin (H&E) stained tissue image of a melanoma biopsy (left panel, adopted from Fig. 3A in Thrane et al.) with the slide-wide distribution of cell type signature scores (middle panel), and the expression patterns of SIRPA and CD47 (right panel). The color key indicates signature score or normalized gene expression. (B) Histogram showing the distribution of receptor-ligand interaction scores for SIRPA in melanoma cells and CD47 in CD8+ T cells computed from the random shuffling of cell type labels. The red dotted line denotes the real score corresponding to the co-expression pattern of SIRPA in melanoma cells and CD47 in CD8+ T cells of the Tirosh cohort. (C) A co-culture system quantifying tumor cell viability upon perturbations. (D) Smoothed histograms showing cell surface SIRPα expression detected by flow cytometry after SIRPA perturbation, knockdown (KD), or overexpression (OE). The knockdown cell lines were constructed by multiple shRNAs. SIRPA KD-E, showing the most robust knockdown efficiency, was selected for downstream experiments. Isotype and B16F10 NTC are the negative and positive controls, respectively. (E, F) Line charts showing relative survival rates of tumor cells at 24 h in co-cultures of different ratios of B16F10 and CD8+ T cells (Pmel-1) without (E) and with (F) the addition of mouse anti-PD-L1 antibody (mPD-L1). (G) Bar plot showing gene expression levels of SIRPA along with six melanoma differentiation antigens in B16F10 cells with SIRPA KD, OE, or control. sig., log2 fold change > 1 and adjusted P < 0.05 by DESeq2; ns., log2 fold change < 1 or adjusted P > 0.05 by DESeq2. (H) Bar plots showing relative survival rates of tumor cells at 24h in co-cultures with CD8+ T cells (Pmel-1) pre-treated with MIAP410 or MIAP430 antibodies to block CD47-SIRPα interaction. (E, F, H) The results are based on three independent mouse experiments, each with three replicates, and the error bars indicate mean ± SEM. P values are based on Student’s t-test; *, P < 0.05; **, P < 0.01; ***, P < 0.001. See also Figure S4.

