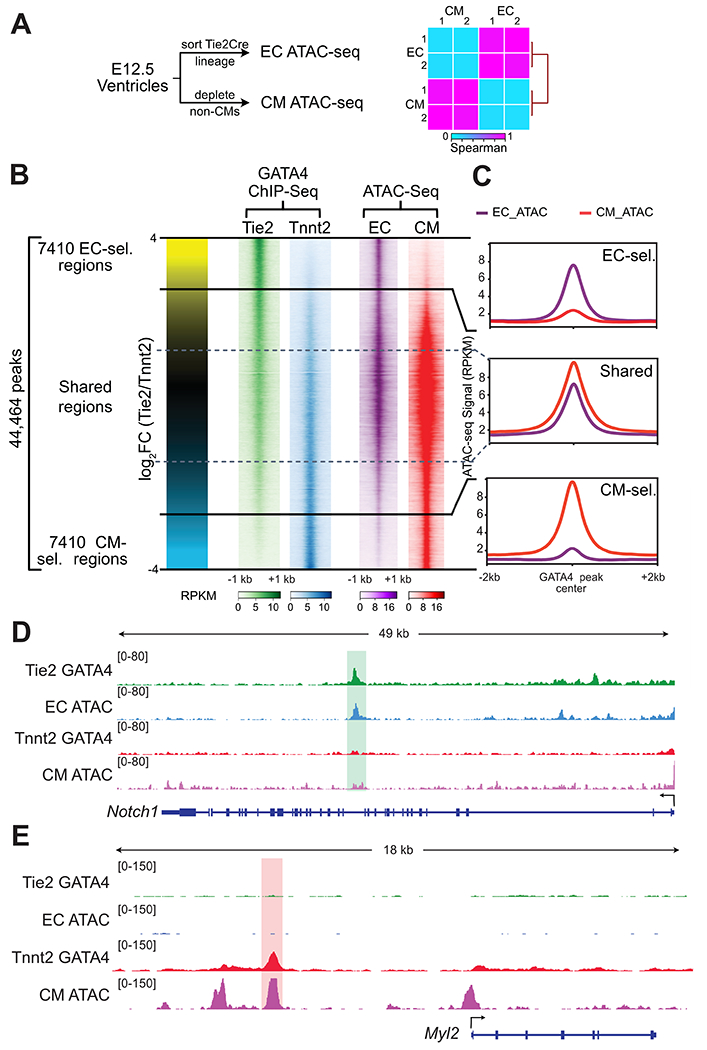
Fig. 4. Lineage selective GATA4 regions and lineage selective chromatin accessibility.

A. Schematic for measuring lineage-selective chromatin accessibility using ATAC-seq. E12.5 ECs and CMs were isolated and chromatin accessibility was measured by ATAC-seq. Heatmap shows Spearman correlation between EC and CM ATAC-seq data across the union of identified peaks. B. Lineage-selective GATA4 regions and lineage-selective chromatin accessibility. Each row represents a GATA4 region, and the color intensity indicates ChIP-seq or ATAC-seq signal. C. ATAC-seq signal at GATA4 regions. EC- and CM- selective GATA4 regions were accessible in the concordant lineage. D,E. Representative browser views showing lineage selective GATA4 and ATAC-seq data.
