
Fig. 5. Effect of ETS1 and NKX2-5 on GATA4 chromatin occupancy.
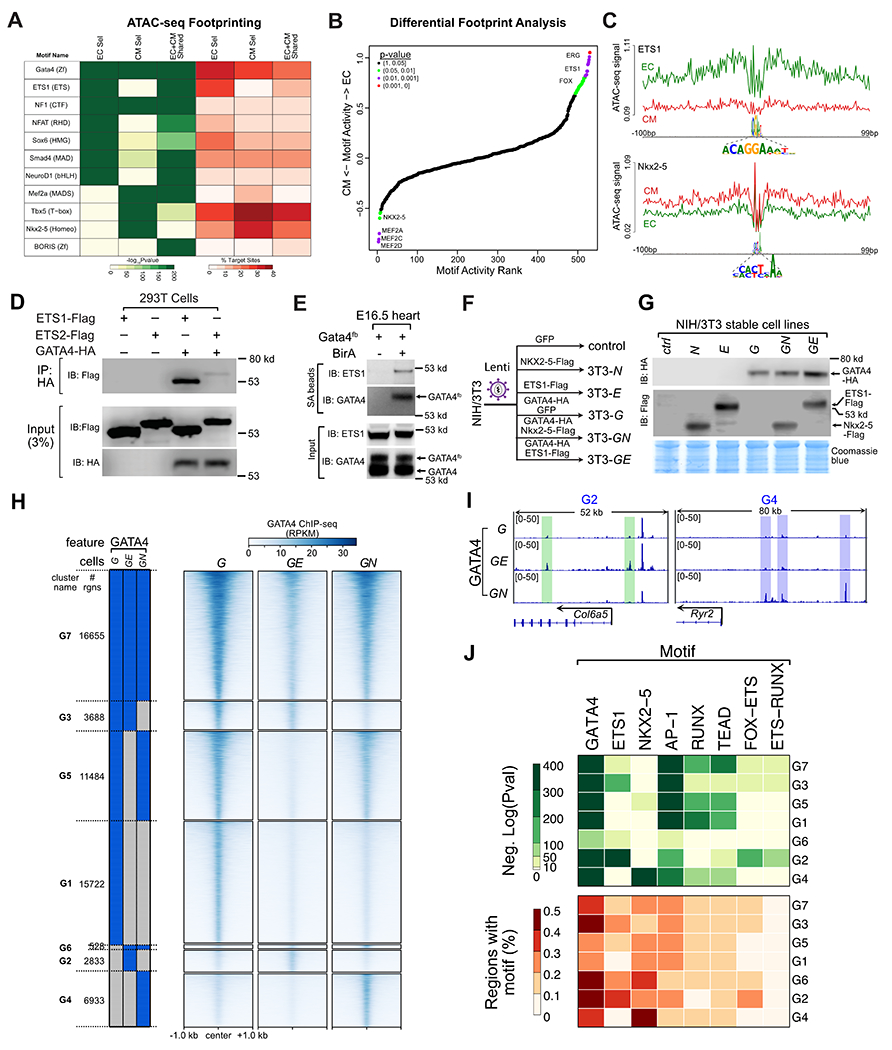
A. Footprint analysis of EC and CM ATAC-seq regions identified enriched TF binding motifs. EC-selective and CM-selective GATA4 regions were enriched for the ETS1 and NKX2-5 motifs, respectively. B. Differential ATAC-seq footprint analysis. EC or CM ATAC-seq at EC-selective or CM-selective GATA4 regions were analyzed for differences in motif enrichment at footprints. Differences in motif activity between lineages were ranked and statistically scored by HINT-ATAC26. C. Lineage-selective footprints of the FOX-ETS and NKX2-5 motifs within EC or CM ATAC-seq signal at EC-selective and CM-selective GATA4 regions, respectively. D. GATA4 and ETS1 interaction by co-IP assay in transfected 293T cells. IP of HA-GATA4 co-precipitated ETS-FLAG. E. ETS1 co-precipitated with GATA4 in E16.5 heart ventricles. Biotinylated GATA4 from Gata4fb;BirA mouse embryonic heart lysate was pulled down by streptavidin (SA) beads. Precipitated proteins were probed with ETS1 antibody. Negative control, Gata4fb hearts without BirA. F. Schematic of stable cell lines used to study ETS1 or NKX2-5 effect on GATA4 occupancy in NIH3T3 cells. Stable NIH3T3 cell lines expressing the indicated proteins were developed using lentivirus. G. Western blot validation of protein expression in the indicated stable cell lines. H. GATA4 occupancy in cells stably expressing GATA4, GATA4 and ETS1 (GE), or GATA4 and NKX2-5 (GN). Regions were clustered by their binary pattern of occupancy across these cell lines. I. Representative genome browser views of differential GATA4 binding in GE (green shading) or GN (blue shading) cells. J. Selected TF motifs enriched among the GATA4 binding clusters.