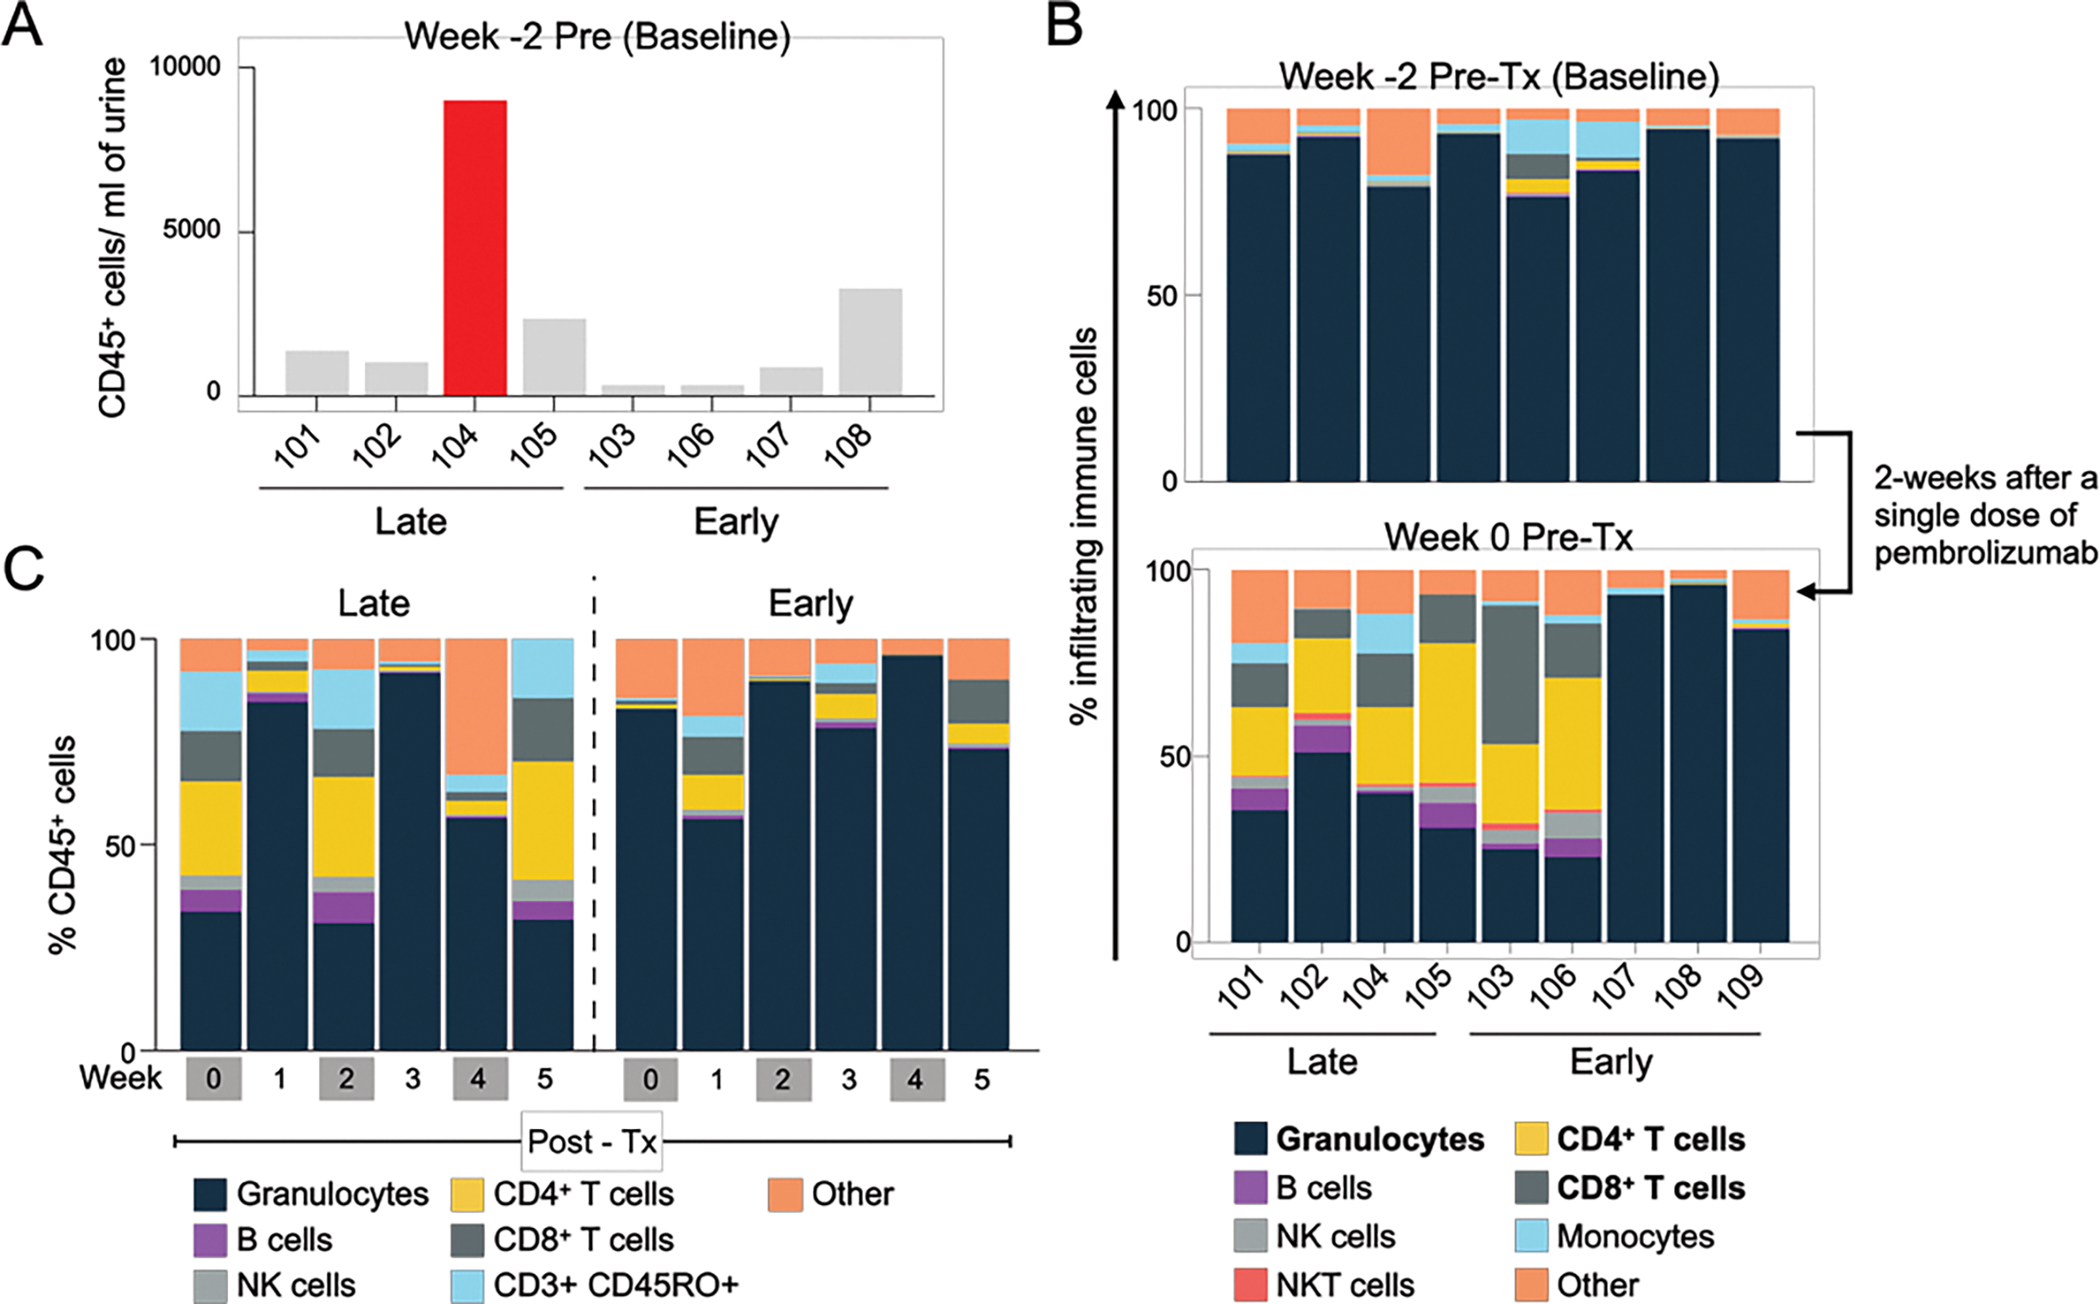
Figure 2: Progressive remodeling of local immune contents over the course of treatment by urine analysis of immune cells and cytokines.

A) CD45+ cell number in the urine at baseline prior to start of treatment. B) Composition of immune cells in the urine at baseline and 2 weeks after administration of single dose of pembrolizumab. C) Changes in immune cell population in the urine during the induction period (Week 0–5). Each bar represents mean of indicated immune cells for each group. (n=4 for Late responders, n=5 for Early responders).
