
Figure 1.
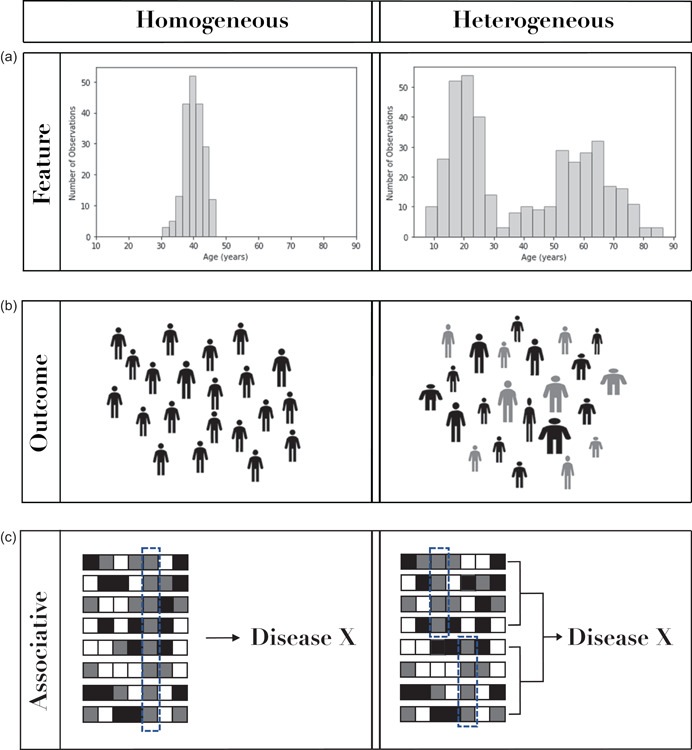
Conceptual illustrations contrasting homogeneity and heterogeneity using example observations within features, outcomes, or associations. Panel (a) depicts age as a feature with less variability on the left and with more variability on the right. Panel (b) depicts a phenotypic outcome, again with less variability on the left and more variability on the right. Panel (c) depicts subjects (rows) and features (columns) where features can have different values (shading). On the left, the feature highlighted by the dotted box is homogeneously associated with Disease X. On the right, associative heterogeneity is represented by two different features independently associated with Disease X within different groups of subjects.