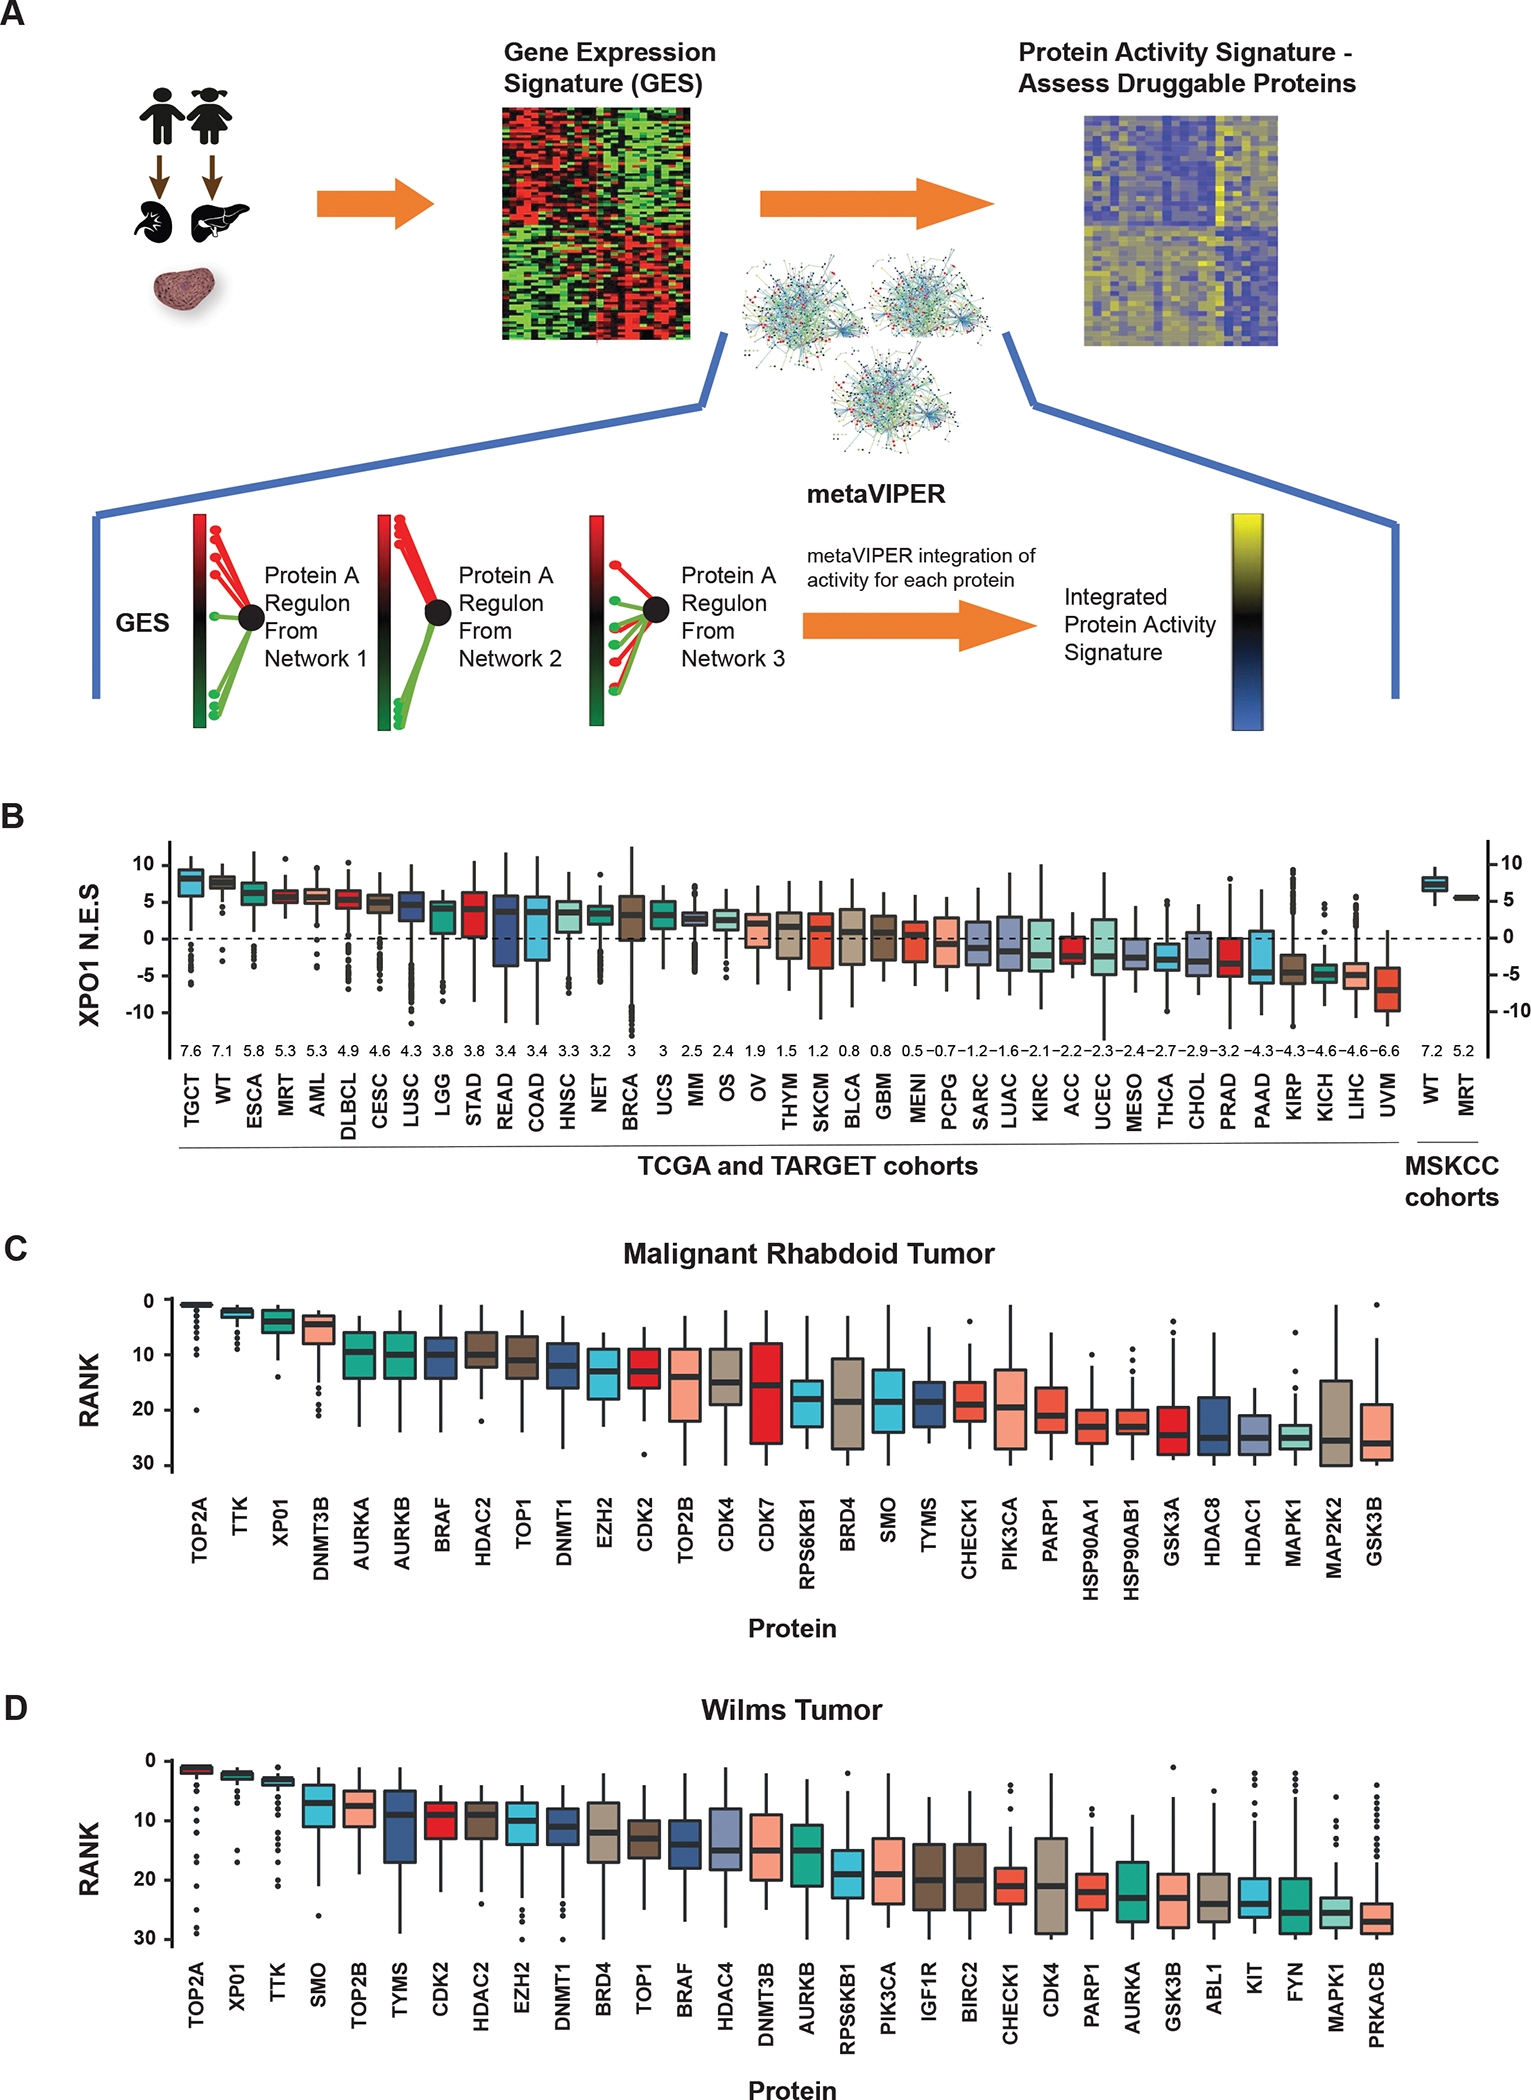
Figure 1:

MetaVIPER inference of XPO1 activity in rhabdoid tumors and Wilms tumor cell lines. A) MetaVIPER analysis schema. Biopsy specimens undergo histopathologic review and cores with ≥ 70% tumor cellularity are reserved for RNAseq. A differential gene expression signature (GES) is computed by comparing the relative expression of each gene with a pan-cancer reference. Gene regulatory networks, e.g. interactomes generated by ARACNe from TCGA cancer cohorts, independently interrogate the GES by enrichment analysis, generating an NES score for each protein representing its transcriptional regulatory activity. The final activity score for each protein is computed by Fisher’s integration of the NES values derived using each network independently. B) Boxplots representing the distribution of metaVIPER inferred XPO1 activity for 33 TCGA tumor cohorts, 3 TARGET pediatric tumor cohorts (MRT, WT, and osteosarcoma), one neuroendocrine tumor cohort, and two MSK cohorts (WT and MRT). The median and interquartile range for NES values is represented by each box for the respective tumor cohort. NES values from enrichment analysis are comparable to Z-scores, with higher scores representing increased activity. C) Boxplots representing metaVIPER prediction rank for each of the top 30 ‘druggable’ proteins for MRT in TARGET (n=68). D) Boxplot of inferred activity for each of the top 30 proteins predicted for Wilms tumor in TARGET (n=132). XPO1 is a significantly activated protein in both MRT and WT. Boxplots representing the top 30 ‘druggable’ proteins in WT demonstrate the distribution of the rank of the protein in the 132 samples. XPO1 ranks as the third most frequently activated druggable protein in MRT and the second most frequently activated druggable protein in WT.
Abbreviations: TCGA, The Cancer Genome Atlas; TARGET, Therapeutically Applicable Research to Generate Effective Treatments; NES, normalized enrichment score; MRT, malignant rhabdoid tumors; WT, Wilms tumors.
