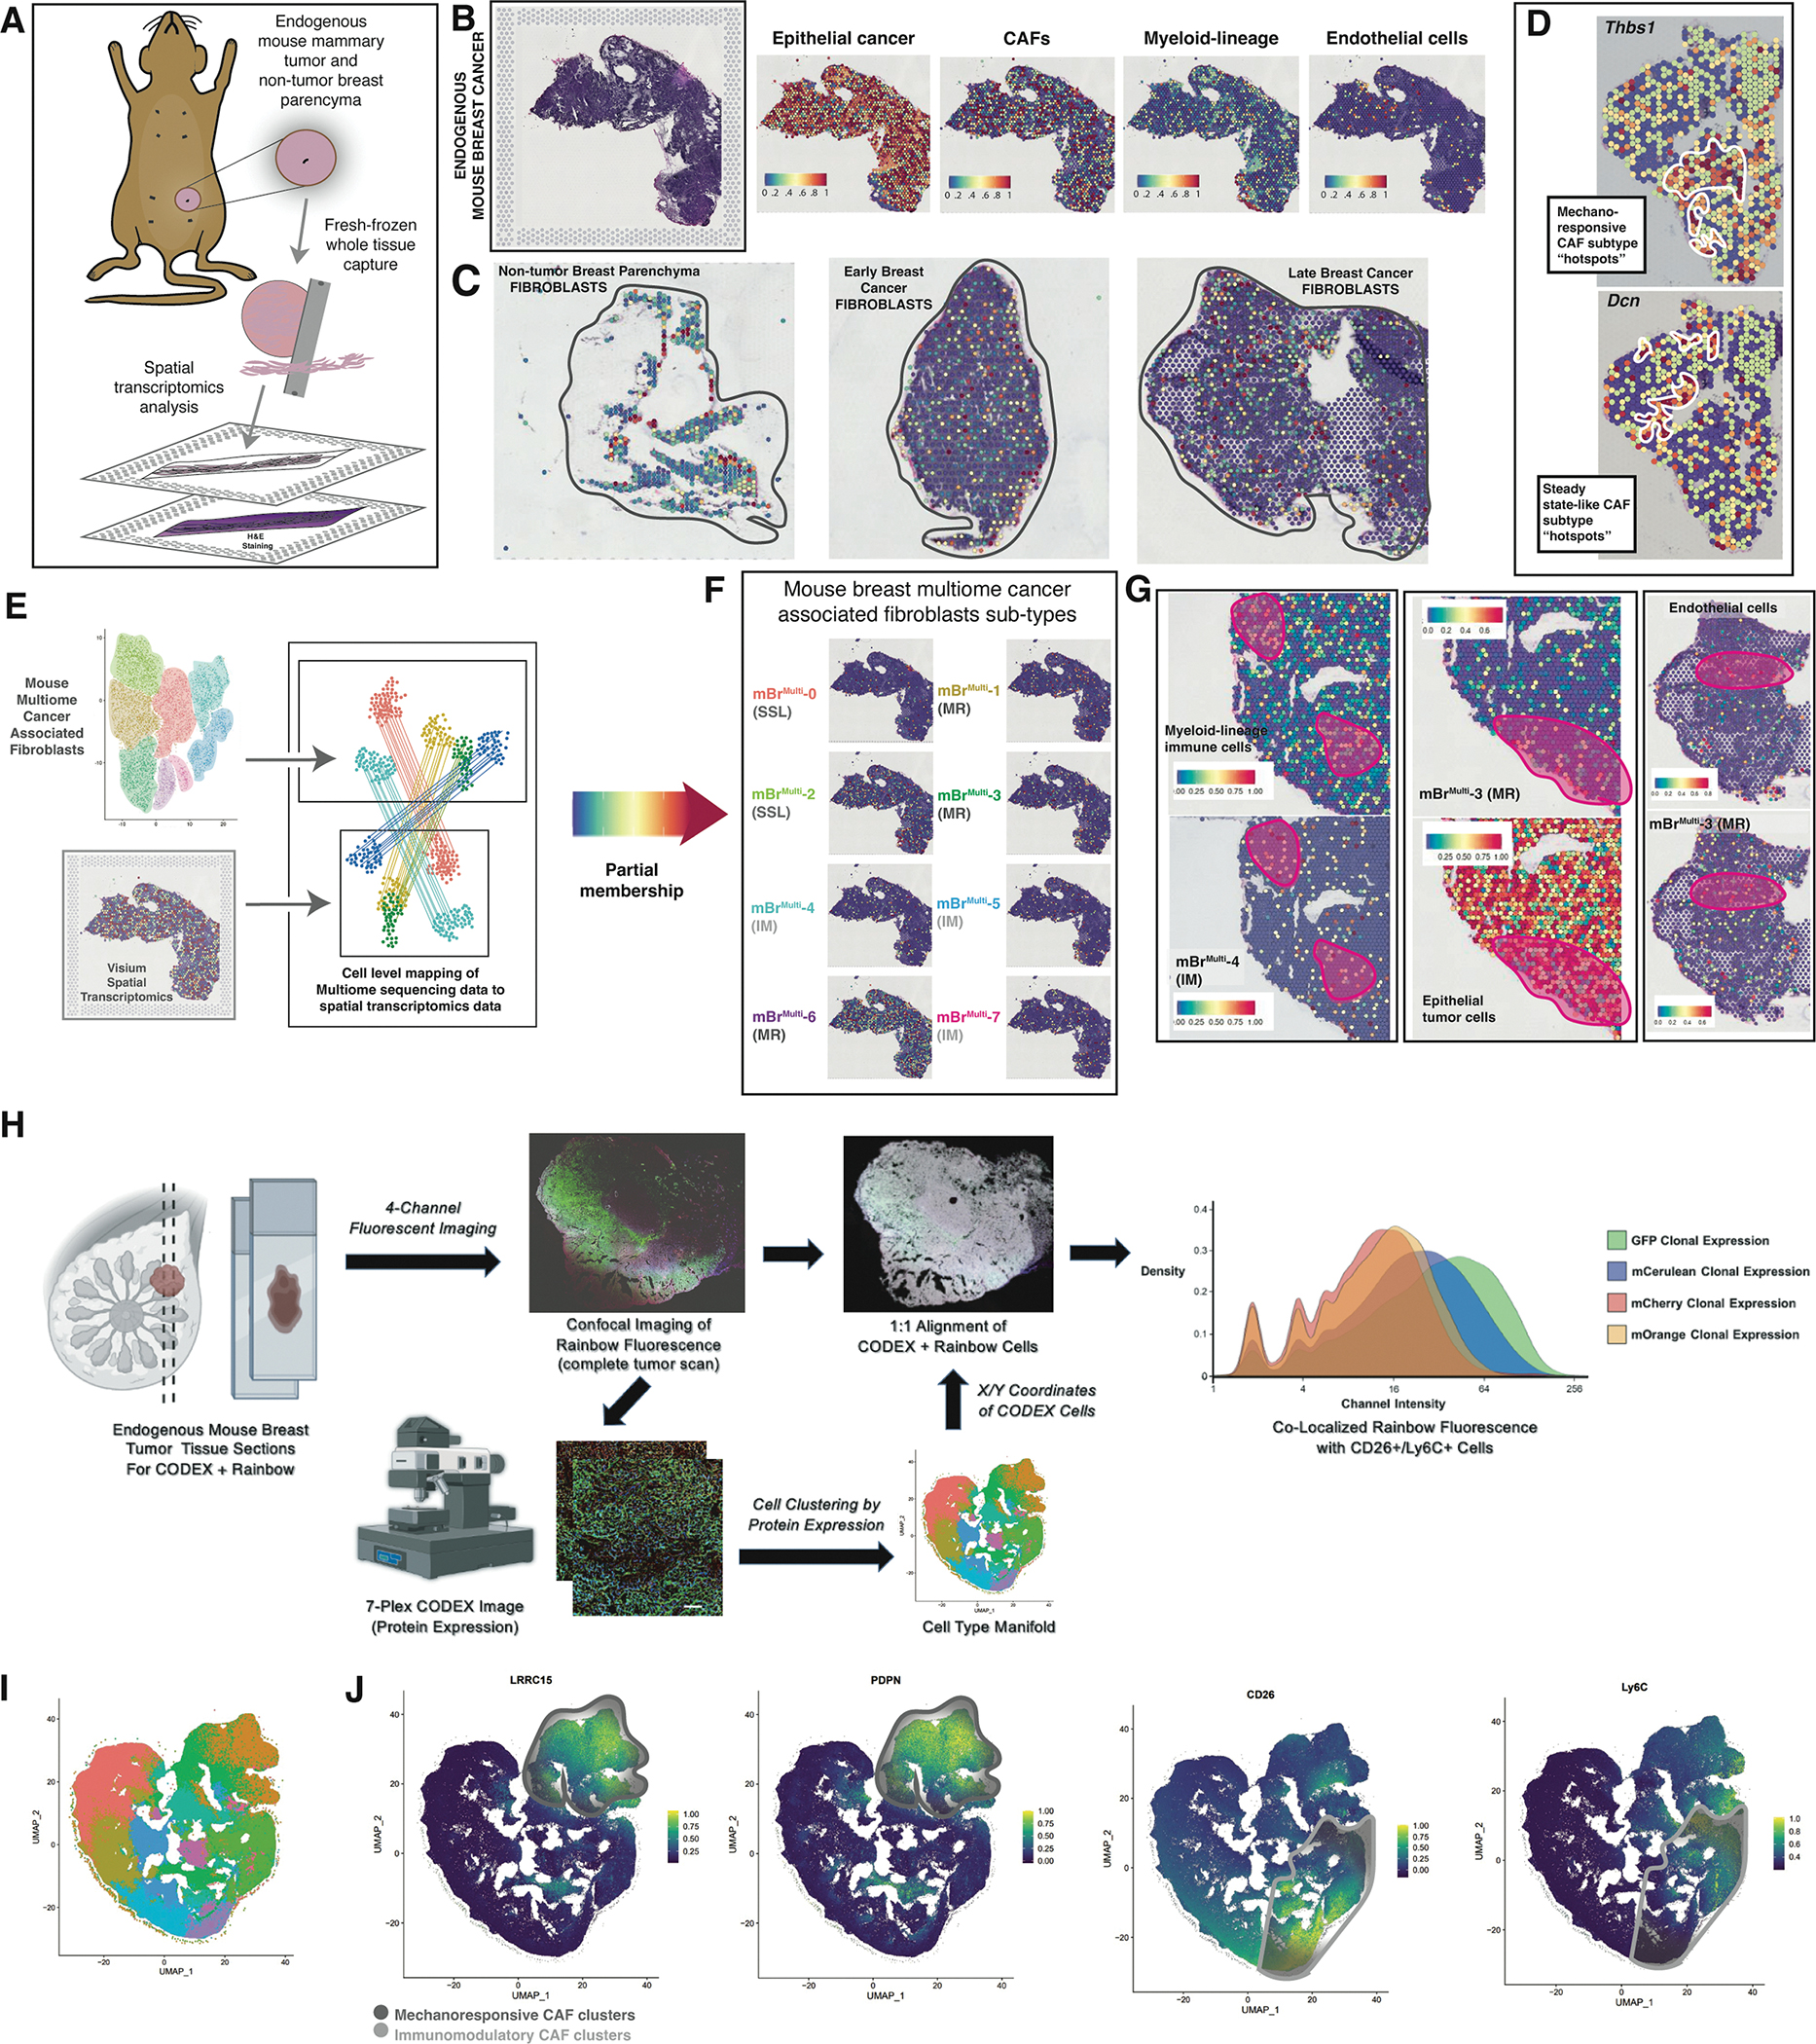
Figure 3. CAF cluster localization and plasticity.

A. Schematic showing 10X Genomics Visium spatial transcriptomic analysis of endogenous mouse breast tumors.
B. H&E staining of a representative section of an endogenous mouse breast tumor used for Visium analysis (left panel). Visium spatial transcriptomic sequencing panels showing cell type represented representation in the representative tumor section (right panels).
C. Representative Visium sections showing CAF representation within normal breast parenchyma, early and late endogenous breast tumors.
D. Spatial transcriptomics plots showing “hot spots” containing CAFs with high expression of key genes characteristic of mechanoresponsive (Thbs1) and steady state-like CAF clusters (Dcn).
E. Cell level mapping of multiome sequencing data to spatial transcriptomics data → Partial membership of mBrRNA CAF clusters represented in mBrVisium data.
F. Visium spatial transcriptomics plots showing representation of each of the mBrMulti CAF clusters on a representative endogenous mouse breast tumor section.
G. Example co-localization of specific mBrMulti CAF clusters with relevant cell types from representative Visium sections, clusters and cell types as labeled in figure, pink circles highlight areas of co-localization.
H. Schematic describing the Rainbow-CODEX workflow. Tumor sections are first imaged for Rainbow fluorescence followed by CODEX staining and analysis, which included spatial analysis at the single cell level. Staining patterns for each cell are represented in two-dimensional UMAP plots, identifying populations of CD26+Ly6C+ SSL/IM CAFs. Cellular location is then identified on the corresponding confocal image and matched to Rainbow fluorophore expression, ultimately confirming the presence of poly-clonal SSL/IM CAFs that once expressed aSMA.
I. UMAP of cell populations derived from CODEX staining in Rainbow mouse breast tumors.
J. CODEX data feature plots demonstrating distinct localization of MR CAFs (LRRC15+, PDPN+) in the upper-right of manifold and SSL/IM CAFs (CD26+, Ly6C+) in the bottom-right of manifold.
