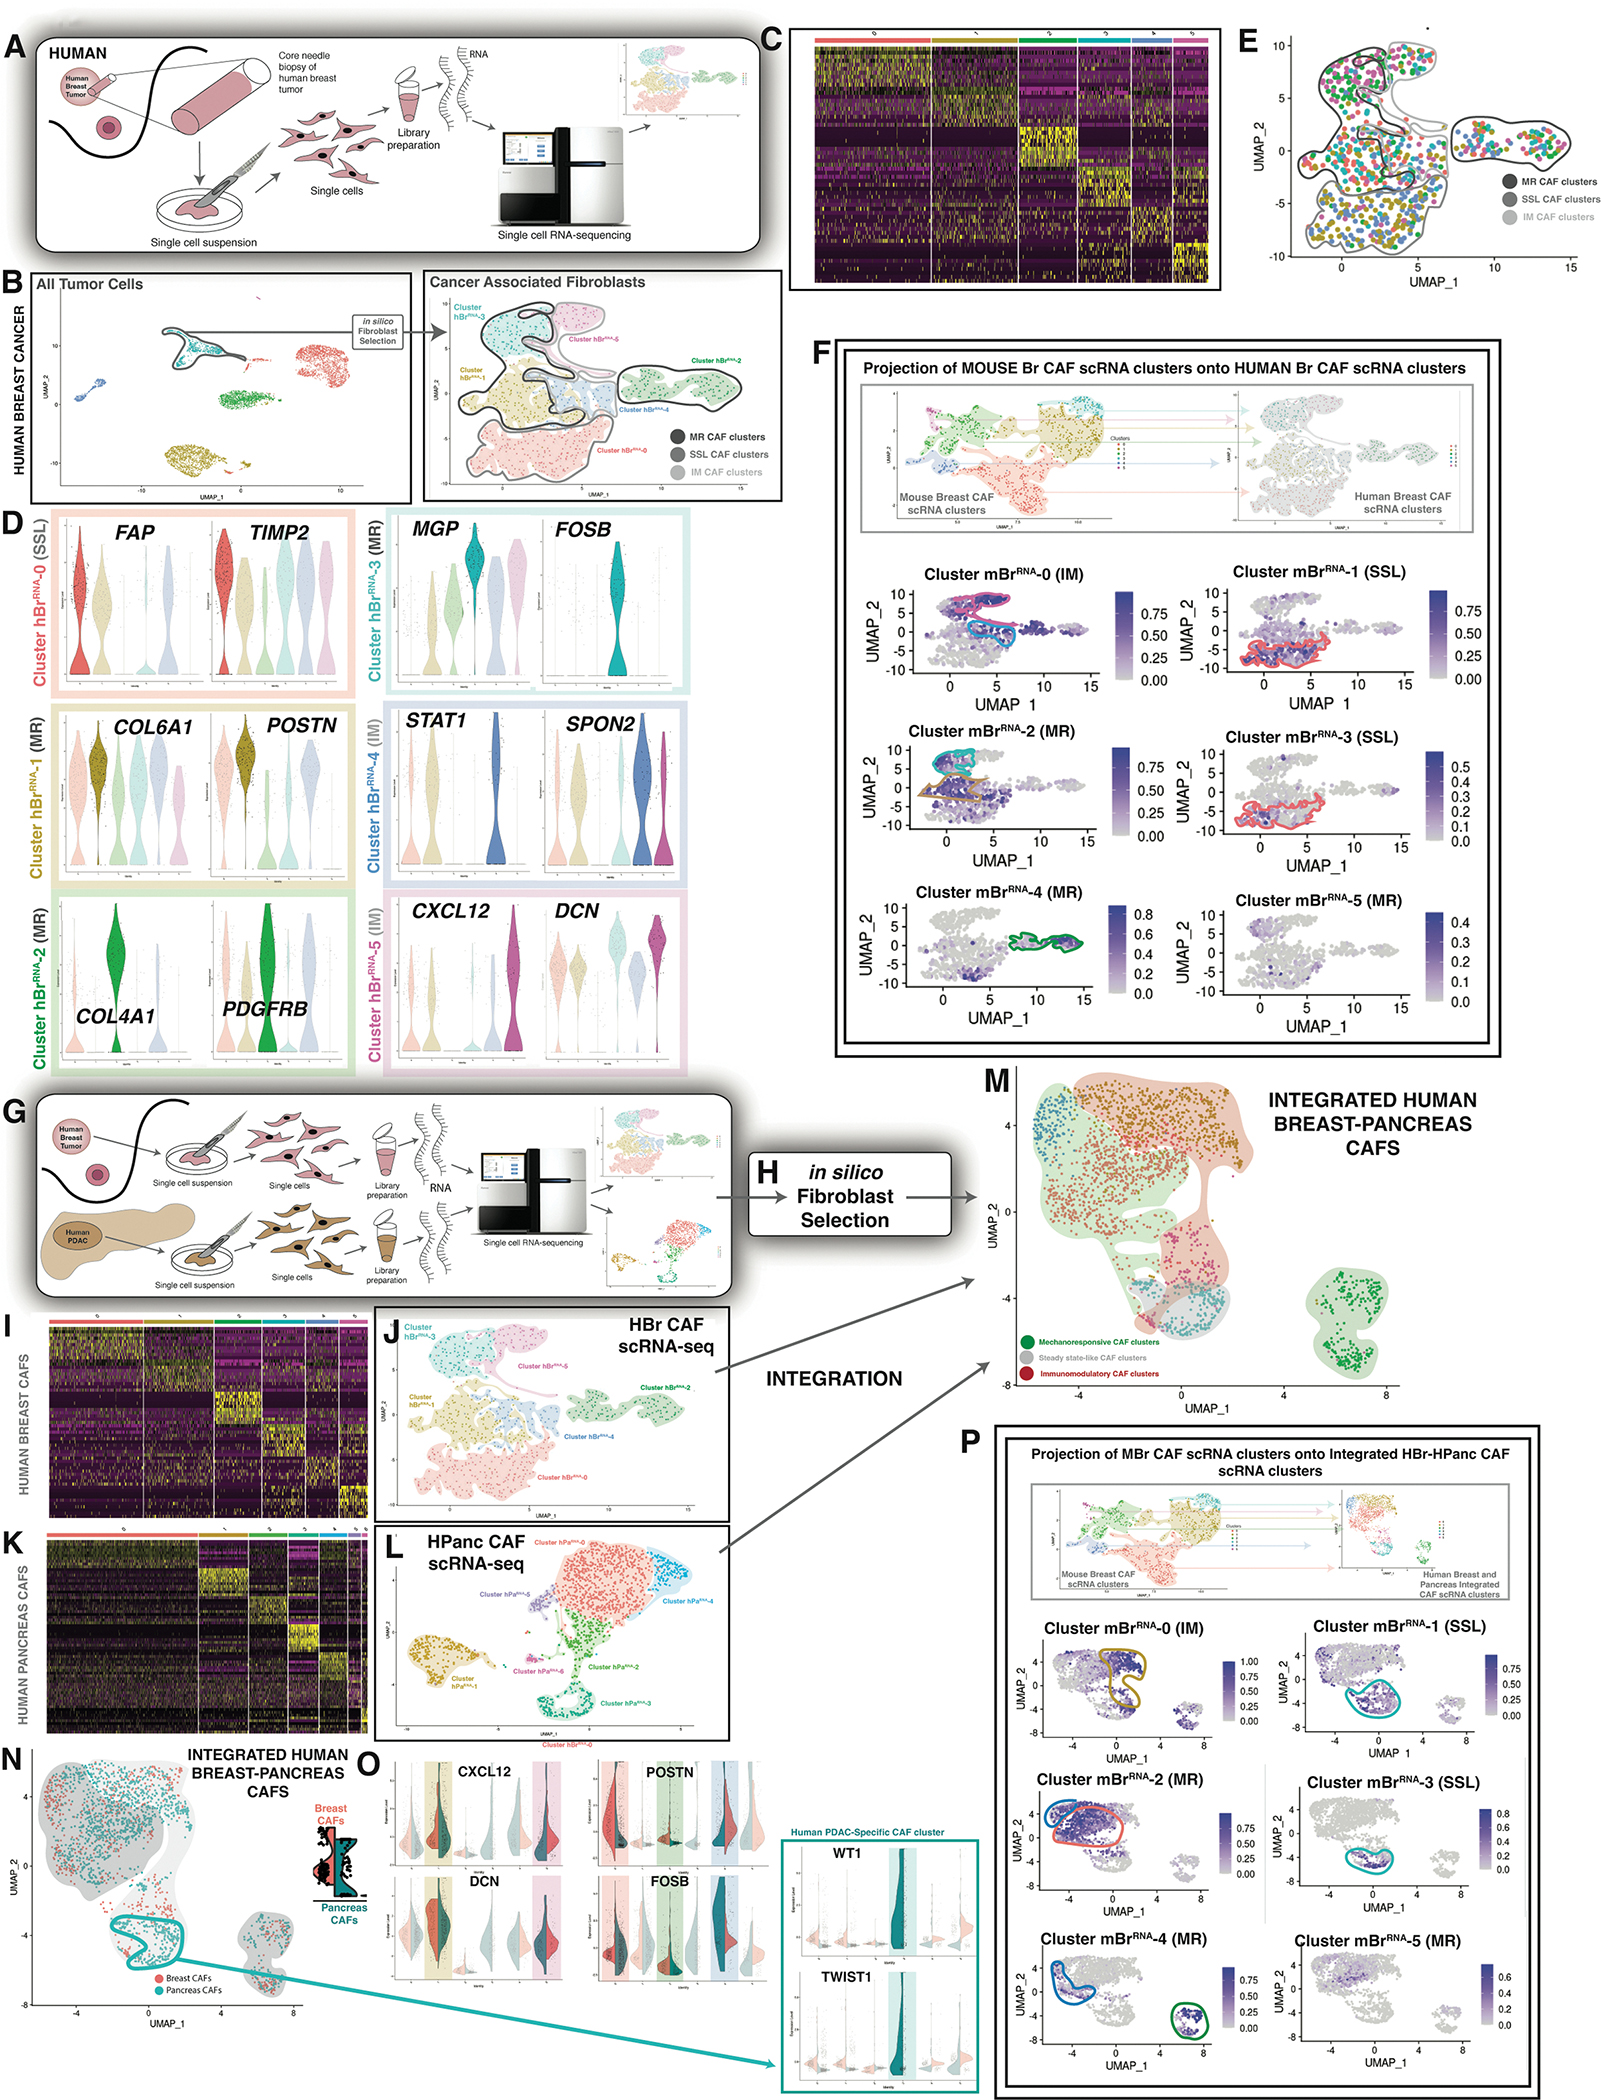
Figure 4. Cross-tumor integration of CAF phenotypes.

A. Schematic showing scRNA-seq of human breast tumor tissue.
B. UMAP plot showing all tumor cells sequenced (top panel) → in silico CAF selection → UMAP plot showing human breast cancer scRNA-seq (hBrRNA) CAF clusters. Clusters as labelled in figure panel (bottom panel).
C. Heatmap showing characteristic differential gene expression for hBrRNA CAF clusters.
D. Violin plots showing differentially expressed genes characteristic of each hBrRNA CAF cluster. Colors represent clusters visualized in B.
E. UMAP plot showing hash-oligo data for the human breast tumors sequenced. Each human sample was stained with two hash-oligos for validation.
F. Label transfer projection of mBrRNA clusters onto hBrRNA CAF clusters. Clusters as labeled in figure panel. CAF clusters indicated with colors corresponding to mBrRNA CAF data.
G. Schematic showing scRNA-seq of human breast and pancreas tumor tissue.
H. In silico CAF selection.
I. Heatmap showing characteristic differential gene expression for hBrRNA CAF clusters.
J. UMAP plot showing hBrRNA CAF clusters as in B (right panel).
J. Heatmap showing characteristic differential gene expression for hPaRNA CAF clusters. (Data represent n=3 unique patient tissue samples as noted).
K. UMAP plot showing hPaRNA CAF clusters.
L. UMAP plot showing integrated human breast-pancreas CAF data (7 clusters). Green shading indicates mechano-responsive CAF clusters whereas gold shading indicates immuno-modulatory CAF clusters.
M. UMAP plot showing integrated human breast-pancreas CAF data in terms of organ of origin.
N. Violin plots showing selected highest-differentially expressed genes characteristic of integrated human breast-pancreas CAF clusters. One cluster is only represented by HPanc CAFs, as indicated (blue box).
O. Label transfer projection of mBrRNA CAF clusters onto integrated human breast-pancreas CAF scRNA-seq clusters. Clusters as labeled in figure panel. CAF clusters indicated with colors corresponding to mBrRNA CAF data.
