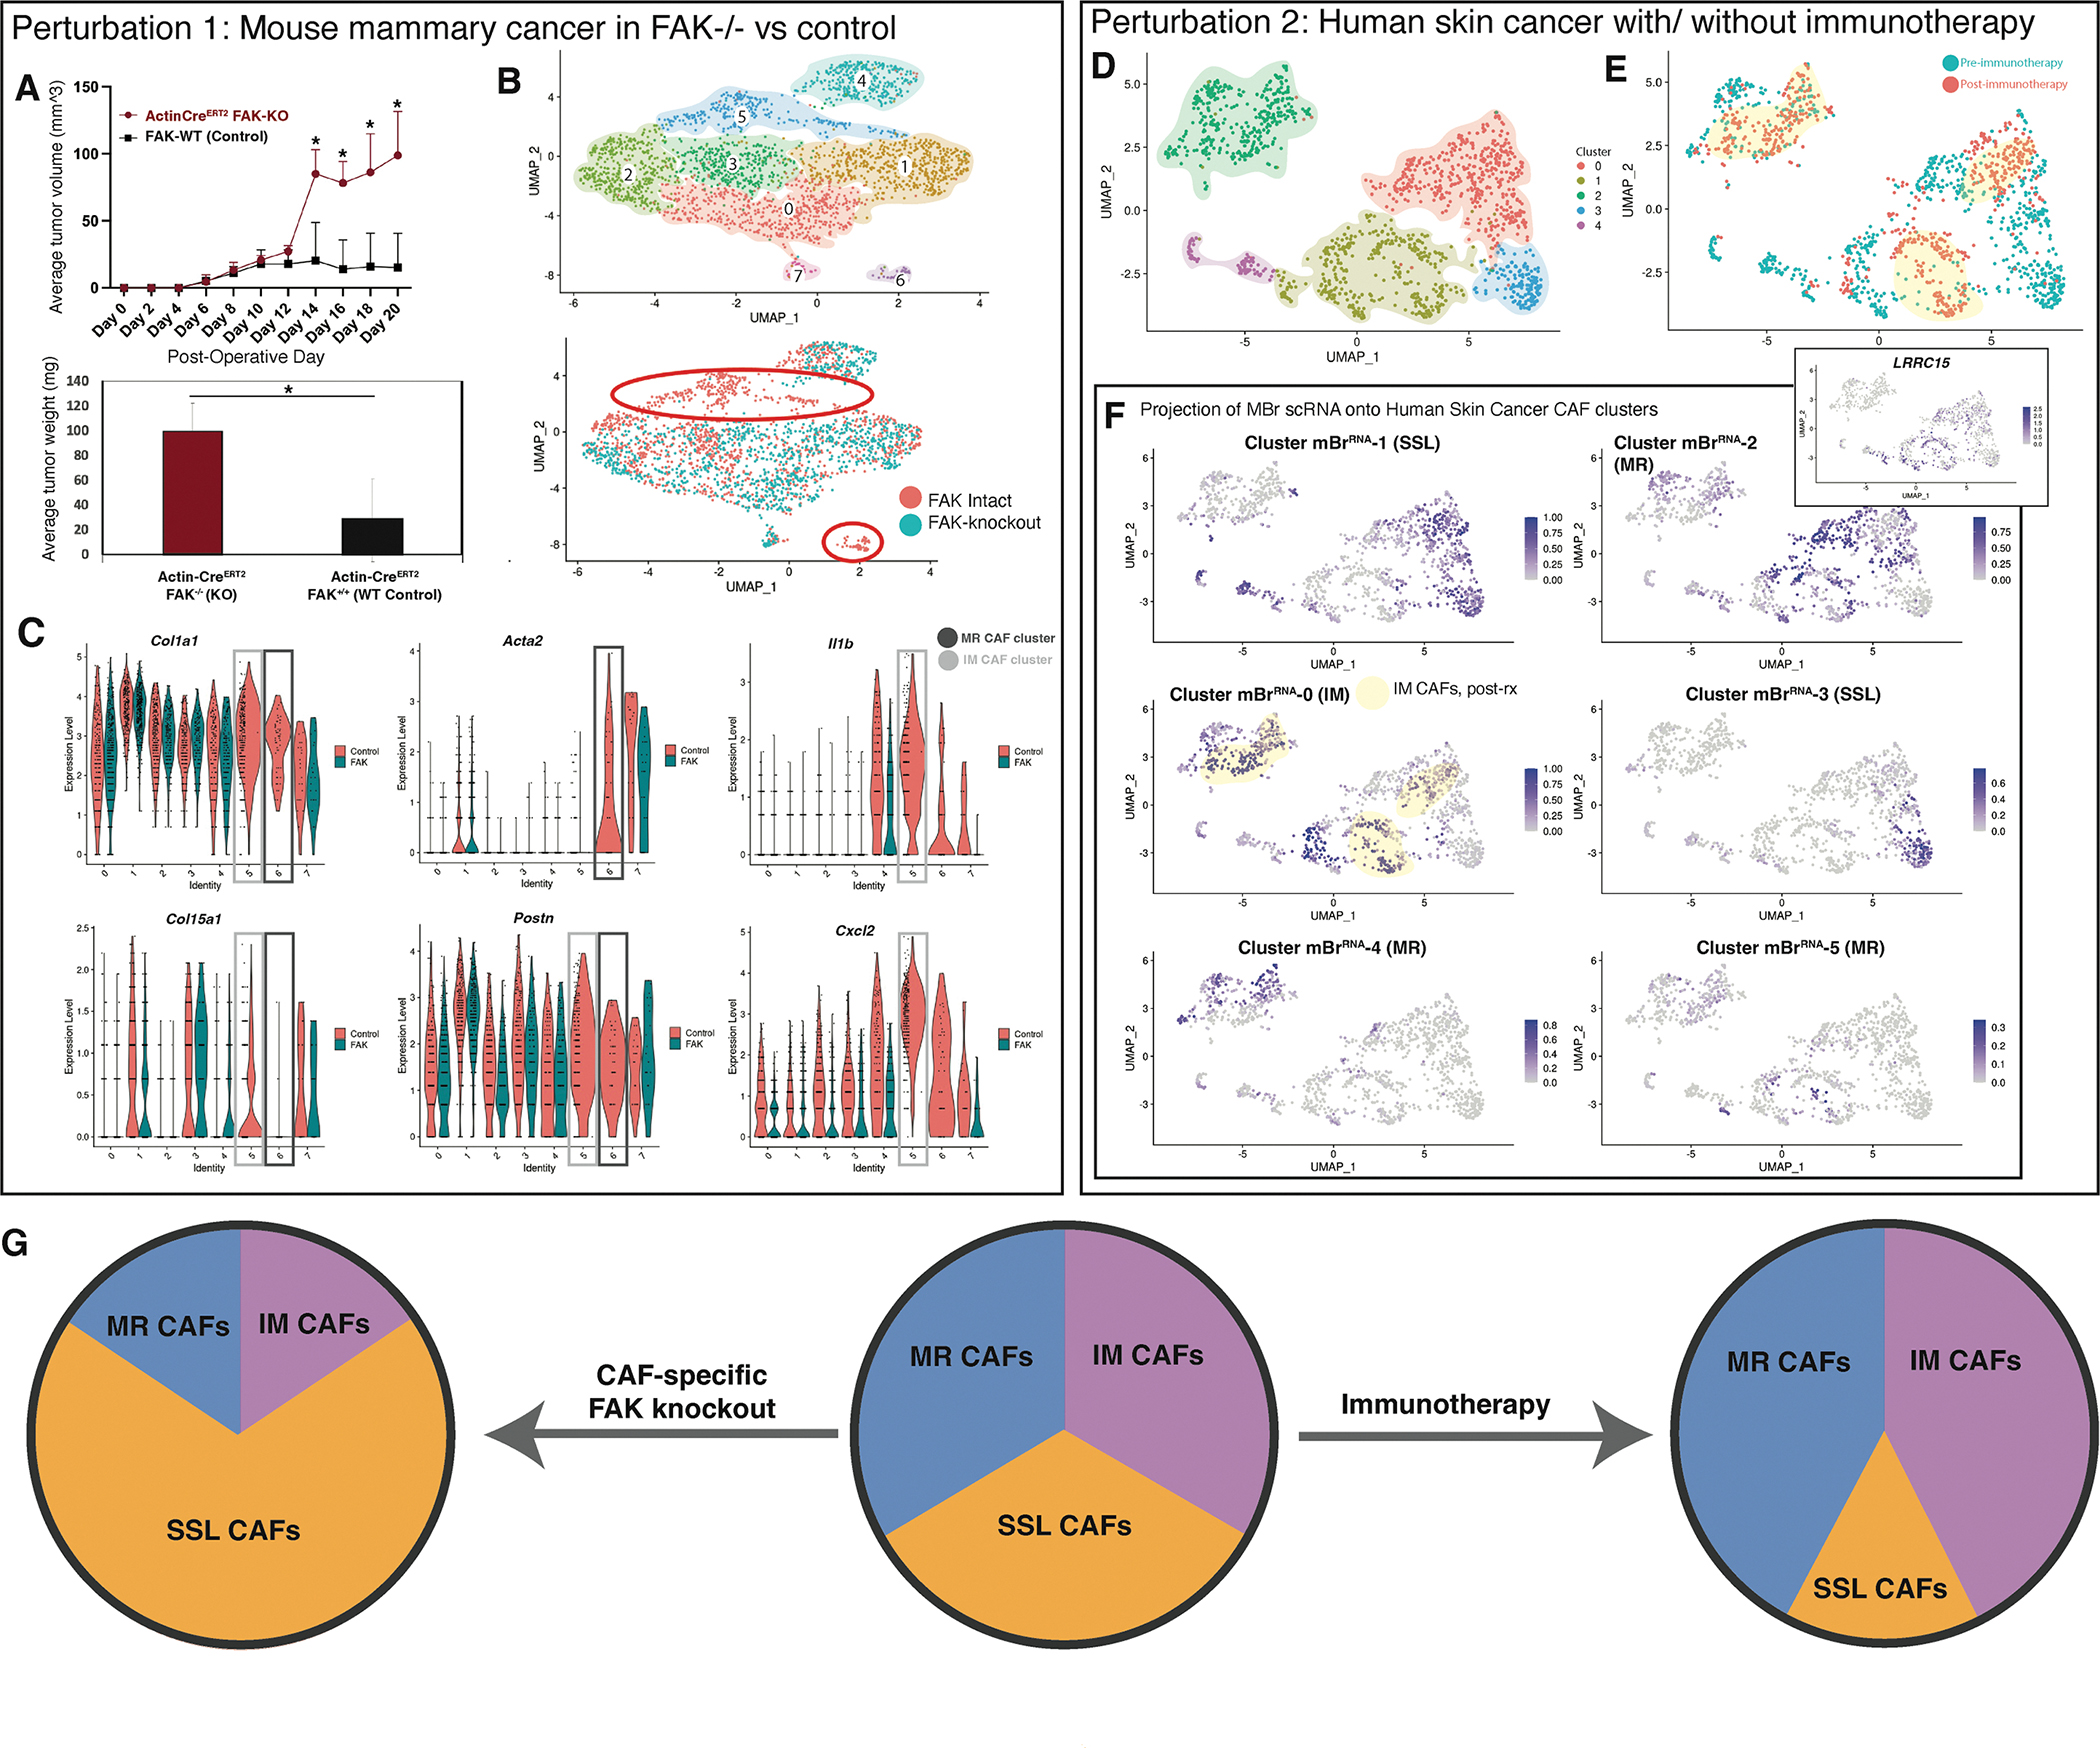
Figure 5. Functional modulation affects the balance of CAF subtypes.

A. Average tumor size comparing allograft mouse breast tumors with global FAK knockout versus control (ActinCreERT2::FAKKO mice) (top panel). Average tumor weight comparing allograft mouse breast tumors with global FAK knockout versus control on day 20 of harvest (ActinCreERT2::FAKKO mice) (bottom panel). POD = post-operative day, KO = knockout, WT = Wildtype, * = p<0.05 (t-test). (Data represent n=3 biological replicates per timepoint per condition unless otherwise noted).
B. UMAP plot showing eight transcriptionally-defined CAF clusters for mouse allograft breast cancer specimens from FAK-intact and Col1a2CreERT2::FAKfl/fl mice (data represent n=3 biological replicates per group, hash-oligos incorporated to distinguish biological replicates) (Top panel). UMAP plot grouped by CAF origin (FAK-intact in red vs Col1a2CreERT2::FAKfl/fl in green). Primary clusters (5 and 6) lost with fibroblast-specific FAK knockout are highlighted with orange circles (bottom panel).
C. Violin plots illustrating expression of genes of interest between CAFs (FAK-intact in red vs Col1a2CreERT2::FAKfl/fl in green). MR and IM CAF clusters of interest highlighted with grey boxes as labelled in the figure panel.
D. UMAP plot showing transcriptionally-defined clusters for human BCC scRNA-seq CAF.
E. UMAP plot from CAF-specific scRNA-seq data colored according to pre- vs post- immune checkpoint blockade for human BCC.
F. Label transfer projection of mouse breast CAF scRNA-seq clusters on human BCC CAF scRNA-seq clusters. Immunomodulatory CAF cluster 0 is highly represented in post-therapy CAFs, while SSL cluster 3 is almost entirely found in pre-therapy samples. These patterns are highlighted with yellow shading. Feature plot of LRRC15 expression shown in inset corresponds closely with MBr cluster 2 (MR1) correlation as anticipated.
G. Schematic summarizing CAF subpopulation perturbations observed with FAK knockout in the context of mouse breast cancer compared with immunotherapy in the context of human BCC.
