
Figure 1. Tumor-specific CD8+ T cells generated by SNP-SC controlled tumor growth when followed by IV adjuvant delivery.
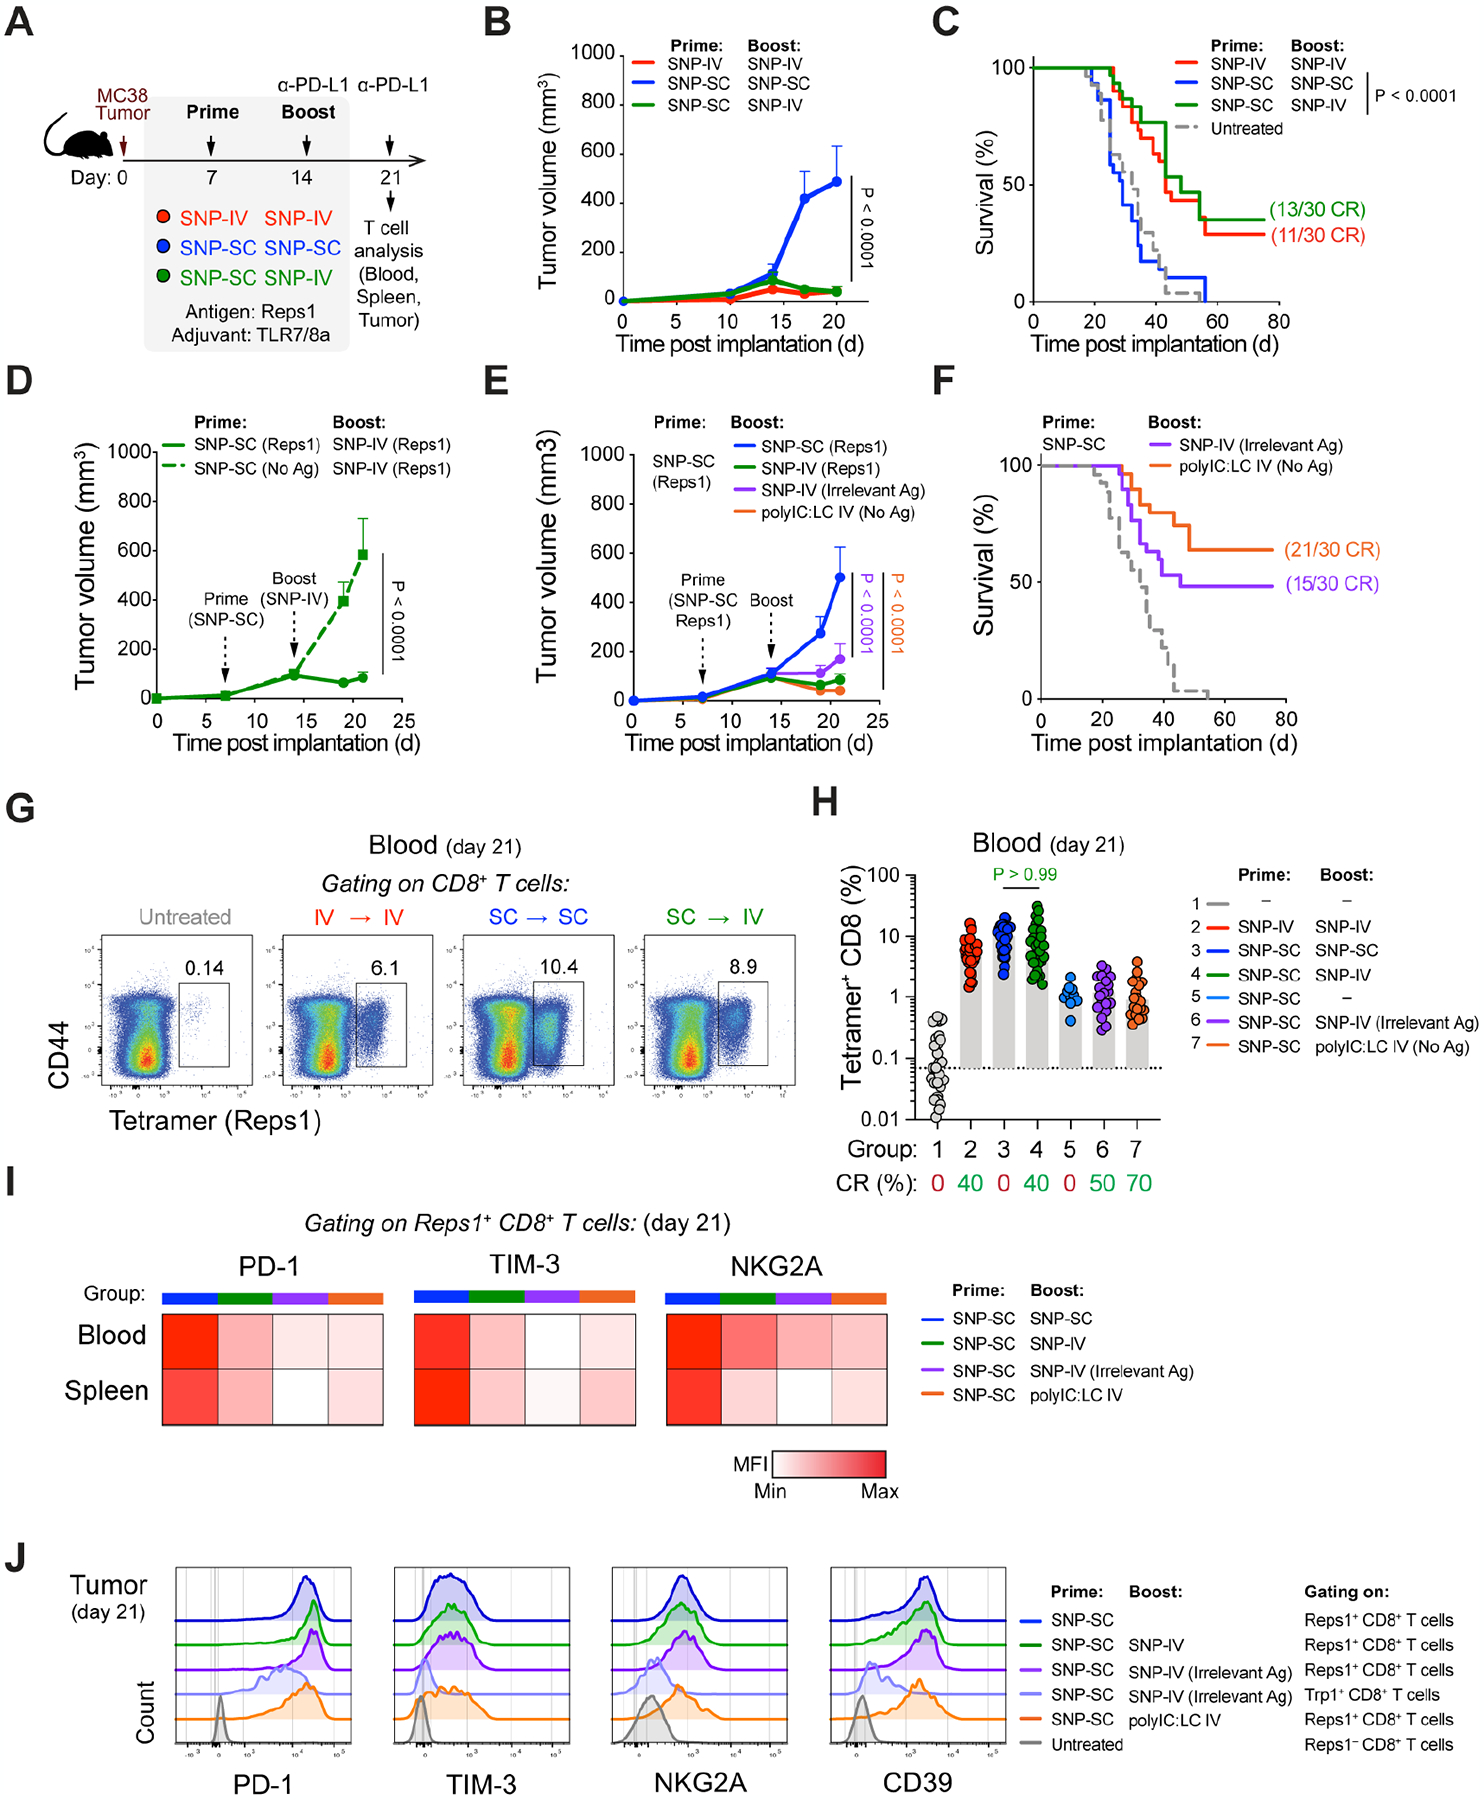
(A) Schematic of therapeutic study design. Mice were implanted with MC38 and treated with SNP-7/8a (Reps1) on day 7 and day 14 together with CPI.
(B) Tumor growth following treatment with SNP-IV prime and boost (red), SNP-SC prime and boost (blue) or SNP-SC prime and SNP-IV boost (green) (n=10). Statistics were assessed by two-way ANOVA.
(C) Survival curve following treatment or in untreated mice (grey) (n=30). Statistics were assessed by log-rank test.
(D) Tumor growth following treatment with SNP-SC prime with Reps1 (solid line) or an irrelevant antigen (dashed line) (n=10). Statistics were assessed by two-way ANOVA.
(E) Tumor growth following treatment SNP-SC prime (Reps1) followed by SNP-IV boost containing an irrelevant antigen (purple) or polyIC:LC (orange) (n=10). Statistics were assessed by two-way ANOVA.
(F) Survival curve following SNP-IV boost containing an irrelevant antigen (purple) or polyIC:LC (orange) or untreated (grey) (n=30). Statistics were assessed by log-rank test.
(G) Flow cytometry analysis of blood stained with tetramer and CD44 antibody (concatenated, n=10).
(H) Bar graph summarizes the frequency of tetramer+ CD8 T cells in blood after treatment (n=30). Statistics were assessed by Kruskal Wallis test.
(I) Heatmaps represent the median MFI of PD-1, Tim-3 and NKG2A on tetramer+ CD8+ T cells in blood (n=10) and spleens (n=5) on day 21.
(J) Histograms summarize the MFI PD-1, Tim-3 and NKG2A and CD39 on CD8+ T cells in tumors (n=5) on day 21.